Note
Go to the end to download the full example code.
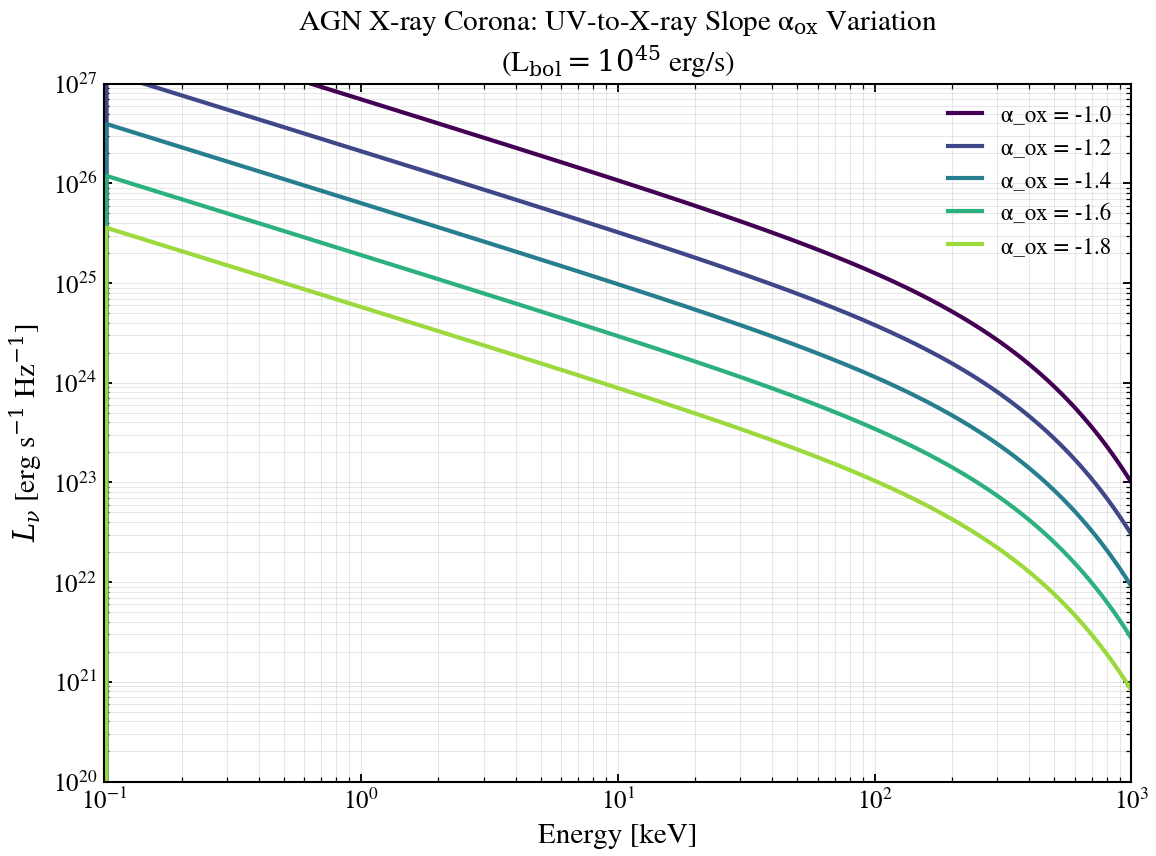
X-ray Normalisation via UV-to-X-ray Slope
Sweep the UV-to-X-ray slope α_ox ∈ {-1.0, -1.2, -1.4, -1.6, -1.8} at fixed bolometric luminosity. More negative α_ox depresses the X-ray relative to the UV — the canonical X-ray-quiet quasar regime.
import jax.numpy as jnp
import matplotlib.pyplot as plt
import numpy as np

from tengri.analysis.plotting import setup_style
from tengri.xray import xray_agn_corona

setup_style()

# Wavelength grid spans 0.1 keV (124 A) to 1000 keV (0.0124 A).
# E[keV] = 12.398 / lambda[A].
wavelength = jnp.logspace(np.log10(0.0124), np.log10(124.0), 512)  # Angstrom
wave_keV = 12.398 / np.array(wavelength)

fig, ax = plt.subplots(figsize=(8, 6))

# UV-to-X-ray slope sweep
alpha_ox_values = [-1.0, -1.2, -1.4, -1.6, -1.8]
L_bol = 1e45  # erg/s (fixed)
n_curves = len(alpha_ox_values)

colors = plt.cm.viridis(np.linspace(0.0, 0.85, n_curves))

for alpha_ox, color in zip(alpha_ox_values, colors):
    l_xray = xray_agn_corona(
        wavelength, L_agn_bol=L_bol, gamma=1.8, E_cut=300.0, alpha_ox=alpha_ox
    )
    ax.loglog(wave_keV, np.array(l_xray), lw=2.0, color=color, label=f"α_ox = {alpha_ox}")

ax.set_xlabel("Energy [keV]")
ax.set_ylabel(r"$L_\nu$ [erg s$^{-1}$ Hz$^{-1}$]")
ax.set_title(
    r"AGN X-ray Corona: UV-to-X-ray Slope α$_{\mathrm{ox}}$ Variation"
    "\n"
    r"(L$_{\mathrm{bol}}=10^{45}$ erg/s)"
)
ax.set_xlim(0.1, 1000)
# Span ~7 decades so every alpha_ox curve stays on-axis across 0.1-1000 keV.
ax.set_ylim(1e20, 1e27)
ax.legend(fontsize=11, frameon=False)
ax.grid(True, alpha=0.3, which="both")

fig.tight_layout()
plt.savefig("plot_alpha_ox_sweep.png", dpi=150, bbox_inches="tight")
plt.show()