Note
Go to the end to download the full example code.
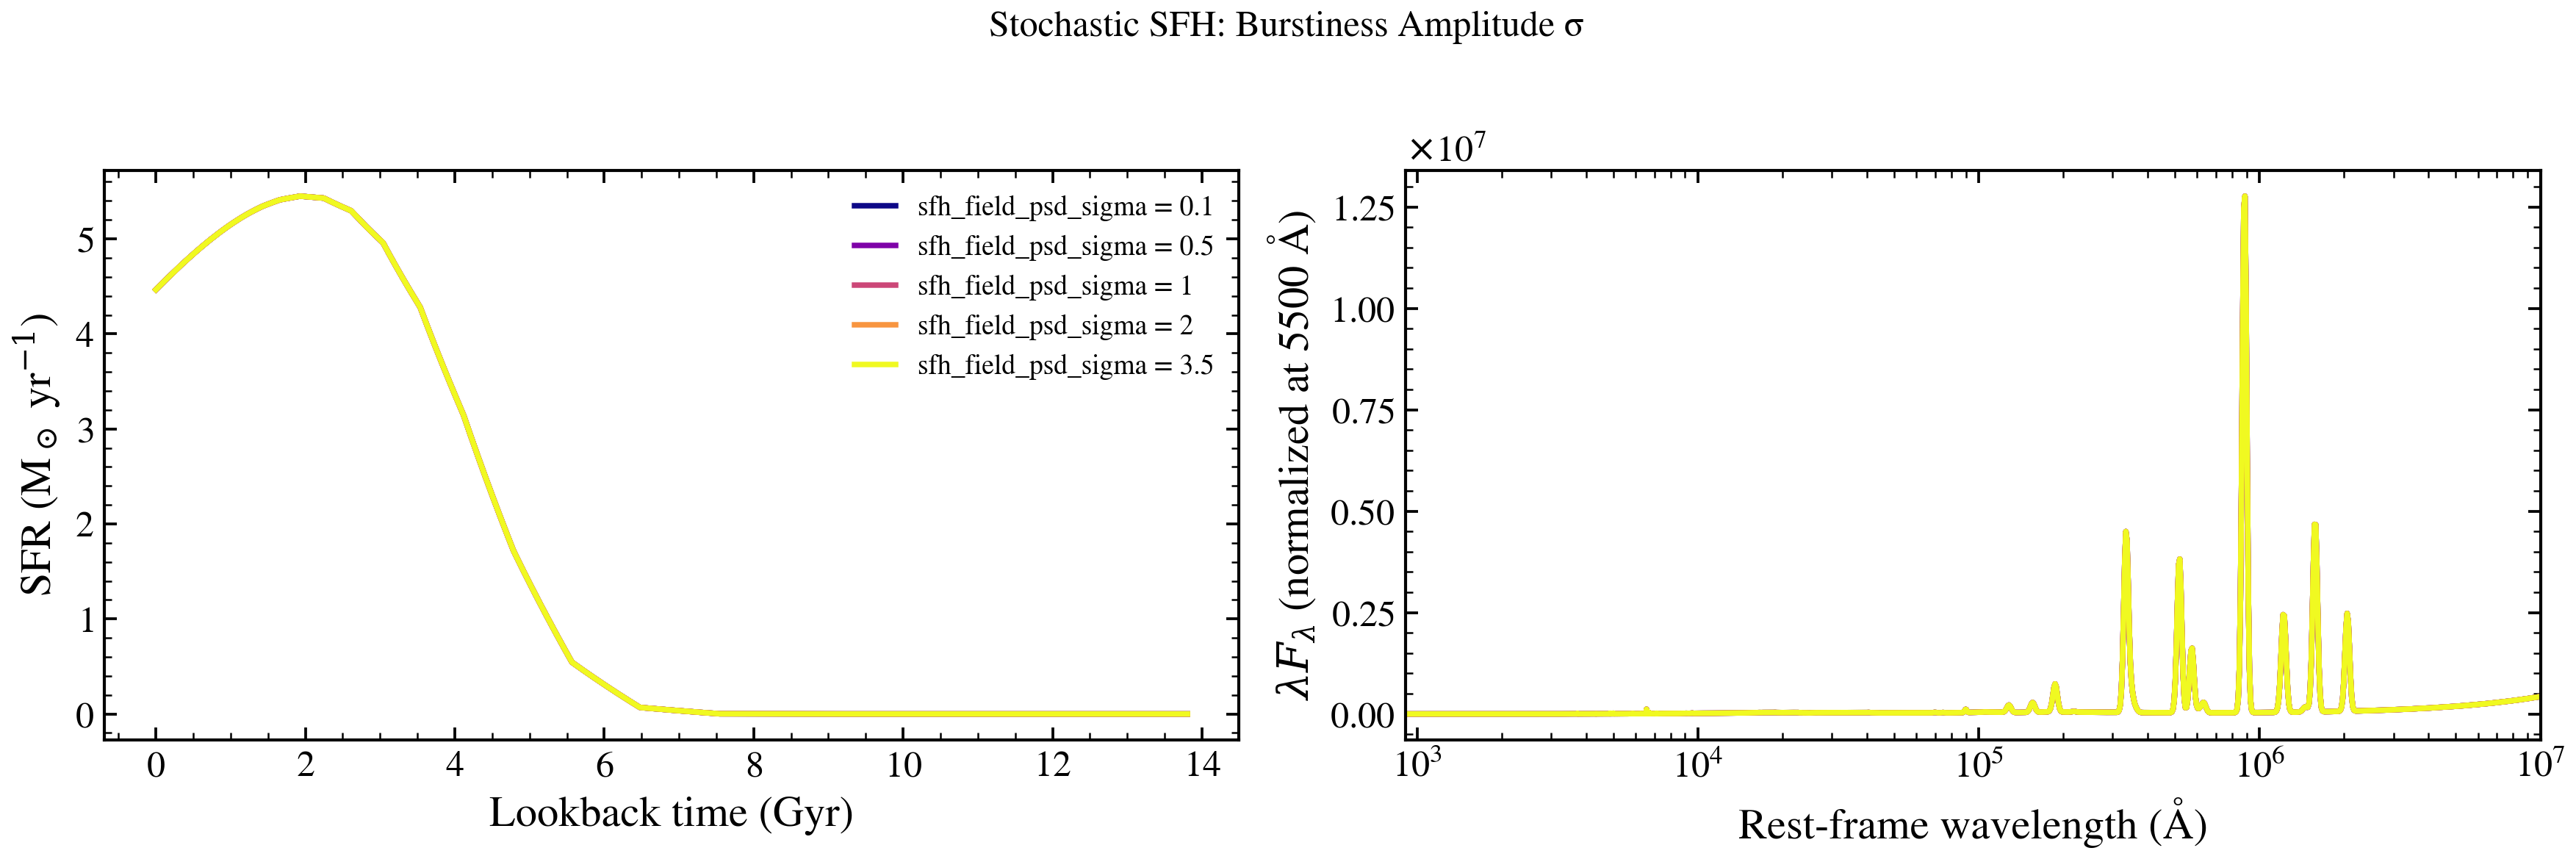
Stochastic SFH: Burstiness Amplitude σ
σ controls how violently star formation fluctuates around the smooth trend. Small σ ≈ smooth; large σ = dramatic bursts.
from pathlib import Path

import jax
import matplotlib.pyplot as plt

jax.config.update("jax_enable_x64", True)

from tengri import Fixed, Parameters, SEDModel, Uniform, load_ssp_data, setup_style
from tengri.analysis.plotting import sfh_sed_comparison

setup_style()


def _find_ssp():
    name = "ssp_prsc_miles_chabrier_wNE_logGasU-3.0_logGasZ0.0.h5"
    for p in [
        Path("data") / name,
        Path("../data") / name,
        Path("../../data") / name,
        Path("../../../data") / name,
    ]:
        if p.exists():
            return str(p)
    return None


SSP_PATH = _find_ssp()
if SSP_PATH is None:
    raise FileNotFoundError("SSP data not found — skipping example")

ssp = load_ssp_data(SSP_PATH)

# Build Parameters with tsnorm + GP field for stochastic SFH
spec = Parameters(
    mean_sfh_type=["tsnorm", "field"],
    sfh_tsnorm_log_peak_sfr=Fixed(1.0),
    sfh_tsnorm_peak_lbt_gyr=Fixed(3.0),
    sfh_tsnorm_width_gyr=Fixed(2.0),
    sfh_tsnorm_skew=Fixed(0.3),
    sfh_tsnorm_trunc=Fixed(2.0),
    sfh_field_psd_sigma=Uniform(0.1, 3.5),  # will be overridden
    sfh_field_psd_tau_myr=Fixed(100.0),
    met_logzsol=Fixed(-0.3),
    dust_tau_bc=Fixed(0.3),
    dust_tau_diff=Fixed(0.2),
    dust_slope=Fixed(-0.7),
    redshift=Fixed(0.1),
)

model = SEDModel(spec, ssp)

# Sweep parameter with stochastic samples
key = jax.random.PRNGKey(0)
values = [0.1, 0.5, 1.0, 2.0, 3.5]

# # The sweep_parameter helper creates a single SEDModel instance and calls
# # model.predict_rest_sed(...) in a loop. JAX JIT compilation is cached
# # automatically via tengri's persistent compilation cache (enabled at
# # import time), so repeated forward model calls reuse the compiled kernel.
fig = sfh_sed_comparison(
    model, "sfh_field_psd_sigma", values, cmap="viridis", n_stochastic=5, key=key
)
# Broad zoomed-out view: full age range and full panchromatic SED. Lets the
# eye see the bursts in context of the full SFH and the SED across all bands.
ax_sfh, ax_sed = fig.axes
ax_sfh.set_xlim(0, 13.7)
ax_sfh.set_ylim(0, 100)

ax_sed.set_xlim(900, 1e7)
ax_sed.set_ylim(1e0, 1e8)

fig.suptitle(r"Stochastic SFH: Burstiness Amplitude $\sigma$", fontsize=14, y=1.00)
plt.tight_layout()
plt.savefig("plot_psd_sigma_sweep.png", dpi=150, bbox_inches="tight")
plt.show()