Note
Go to the end to download the full example code.
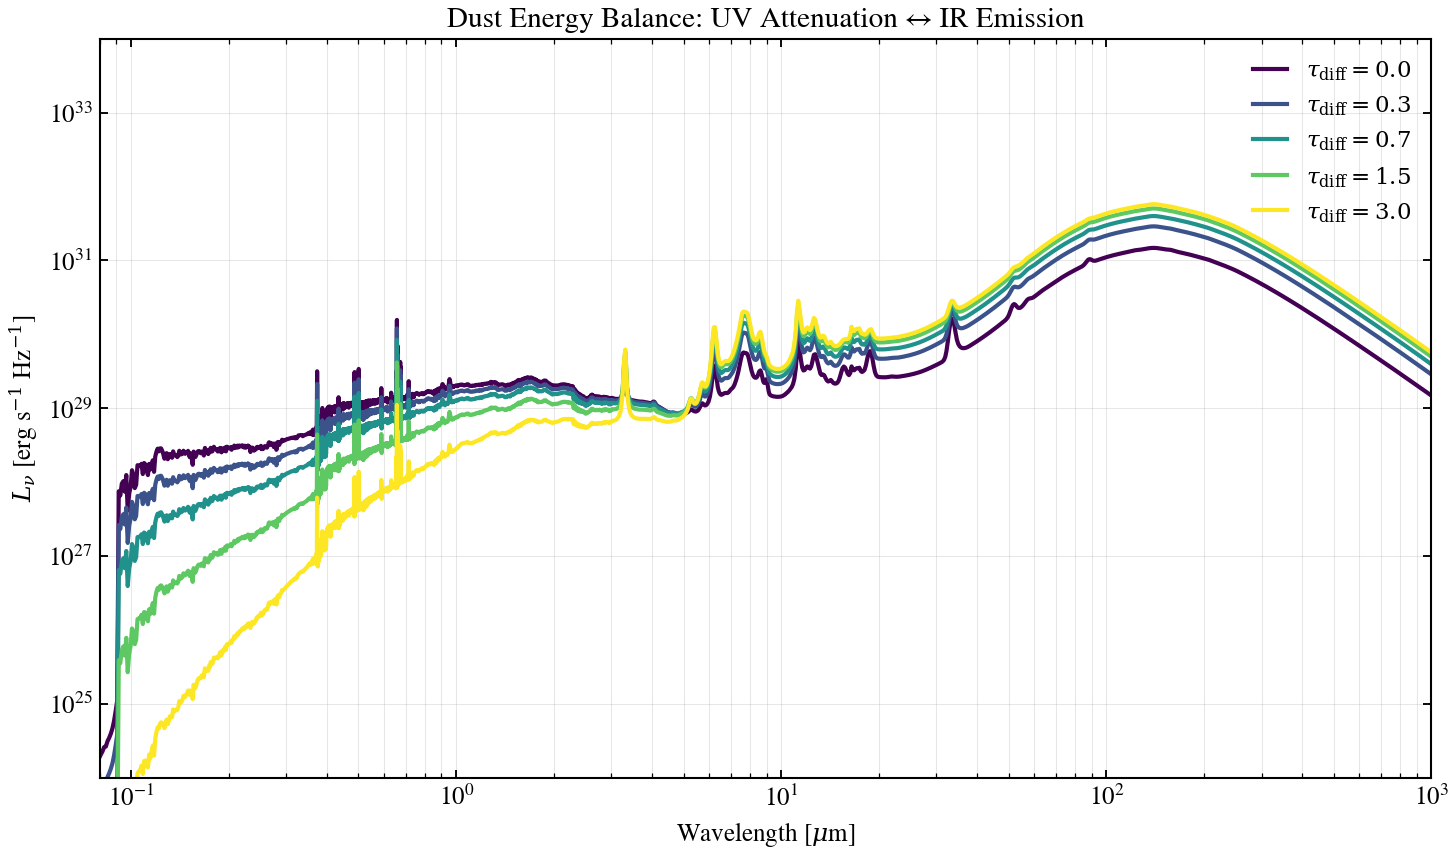
Dust Energy Balance: UV Attenuation ↔ IR Emission
Dust absorbs UV and optical photons and re-emits at infrared wavelengths. This script demonstrates energy conservation between attenuation and emission: sweeping dust optical depth τ_diff ∈ {0.0, 0.3, 0.7, 1.5, 3.0} on a panchromatic SED shows how UV absorption transfers energy to the IR.
from pathlib import Path

import jax
import jax.numpy as jnp
import matplotlib

matplotlib.use("Agg")
import matplotlib.pyplot as plt
import numpy as np

jax.config.update("jax_enable_x64", True)

from tengri import (
    Fixed,
    Observation,
    Parameters,
    SEDModel,
    Spectroscopy,
    load_ssp_data,
    setup_style,
)

setup_style()


def _find_ssp():
    """Find SSP data file in standard locations."""
    name = "ssp_prsc_miles_chabrier_wNE_logGasU-3.0_logGasZ0.0.h5"
    for p in [
        Path("data") / name,
        Path("../data") / name,
        Path("../../data") / name,
        Path("../../../data") / name,
    ]:
        if p.exists():
            return str(p)
    return None


ssp_path = _find_ssp()
if ssp_path is None:
    raise FileNotFoundError("SSP data not found — skipping example")

ssp = load_ssp_data(ssp_path)

# Wavelength grid: UV through near-IR
wave_sed = jnp.logspace(jnp.log10(1000.0), jnp.log10(1e7), 800)  # 0.1 µm – 1 mm [Å]
obs = Observation(spectroscopy=Spectroscopy(wave_obs=wave_sed))

# Base parameters: young star-forming galaxy
spec_base = Parameters(
    mean_sfh_type="tsnorm",
    dust_emission="draine_li2007",
    sfh_tsnorm_log_peak_sfr=Fixed(1.0),  # peak SFR ~ 10 Msun/yr
    sfh_tsnorm_peak_lbt_gyr=Fixed(2.0),
    sfh_tsnorm_width_gyr=Fixed(1.5),
    sfh_tsnorm_skew=Fixed(0.0),
    sfh_tsnorm_trunc=Fixed(2.0),
    met_logzsol=Fixed(0.0),
    dust_tau_bc=Fixed(0.5),
    # dust_tau_diff will vary
    dust_slope=Fixed(-0.7),
    dust_umin=Fixed(2.0),
    dust_qpah=Fixed(3.5),
    dust_gamma_dl=Fixed(0.02),
    redshift=Fixed(0.05),
)

model = SEDModel(spec_base, ssp, observation=obs)
key = jax.random.PRNGKey(42)

# Dust optical depths to sweep
tau_diffs = [0.0, 0.3, 0.7, 1.5, 3.0]
cmap = plt.cm.viridis
colors = [cmap(i / (len(tau_diffs) - 1)) for i in range(len(tau_diffs))]

fig, ax = plt.subplots(figsize=(10, 6))

for tau_diff, color in zip(tau_diffs, colors):
    spec = Parameters(
        mean_sfh_type="tsnorm",
        dust_emission="draine_li2007",
        sfh_tsnorm_log_peak_sfr=Fixed(1.0),
        sfh_tsnorm_peak_lbt_gyr=Fixed(2.0),
        sfh_tsnorm_width_gyr=Fixed(1.5),
        sfh_tsnorm_skew=Fixed(0.0),
        sfh_tsnorm_trunc=Fixed(2.0),
        met_logzsol=Fixed(0.0),
        dust_tau_bc=Fixed(0.5),
        dust_tau_diff=Fixed(tau_diff),
        dust_slope=Fixed(-0.7),
        dust_umin=Fixed(2.0),
        dust_qpah=Fixed(3.5),
        dust_gamma_dl=Fixed(0.02),
        redshift=Fixed(0.05),
    )
    model = SEDModel(spec, ssp, observation=obs)
    params = spec.sample(key)
    pred = model.predict_rest_sed(params)

    wave_um = np.array(pred.wavelength) / 1e4
    l_nu = np.array(pred.sed)

    mask = l_nu > 0
    ax.loglog(
        wave_um[mask],
        l_nu[mask],
        color=color,
        lw=2.0,
        label=rf"$\tau_{{\rm diff}} = {tau_diff}$",
    )

ax.set_xlabel(r"Wavelength [$\mu$m]", fontsize=12)
ax.set_ylabel(r"$L_\nu$ [erg s$^{-1}$ Hz$^{-1}$]", fontsize=12)
ax.set_title("Dust Energy Balance: UV Attenuation ↔ IR Emission", fontsize=14)
ax.legend(fontsize=11, frameon=False, loc="upper right")
ax.grid(True, alpha=0.3, which="both")
ax.set_xlim(0.08, 1e3)
ax.set_ylim(1e24, 1e34)

fig.tight_layout()
# Save to script directory
script_dir = Path(__file__).resolve().parent if "__file__" in dir() else Path(".")
plt.savefig(str(script_dir / "plot_panchromatic_dust_balance.png"), dpi=150, bbox_inches="tight")
plt.close()