Note
Go to the end to download the full example code.
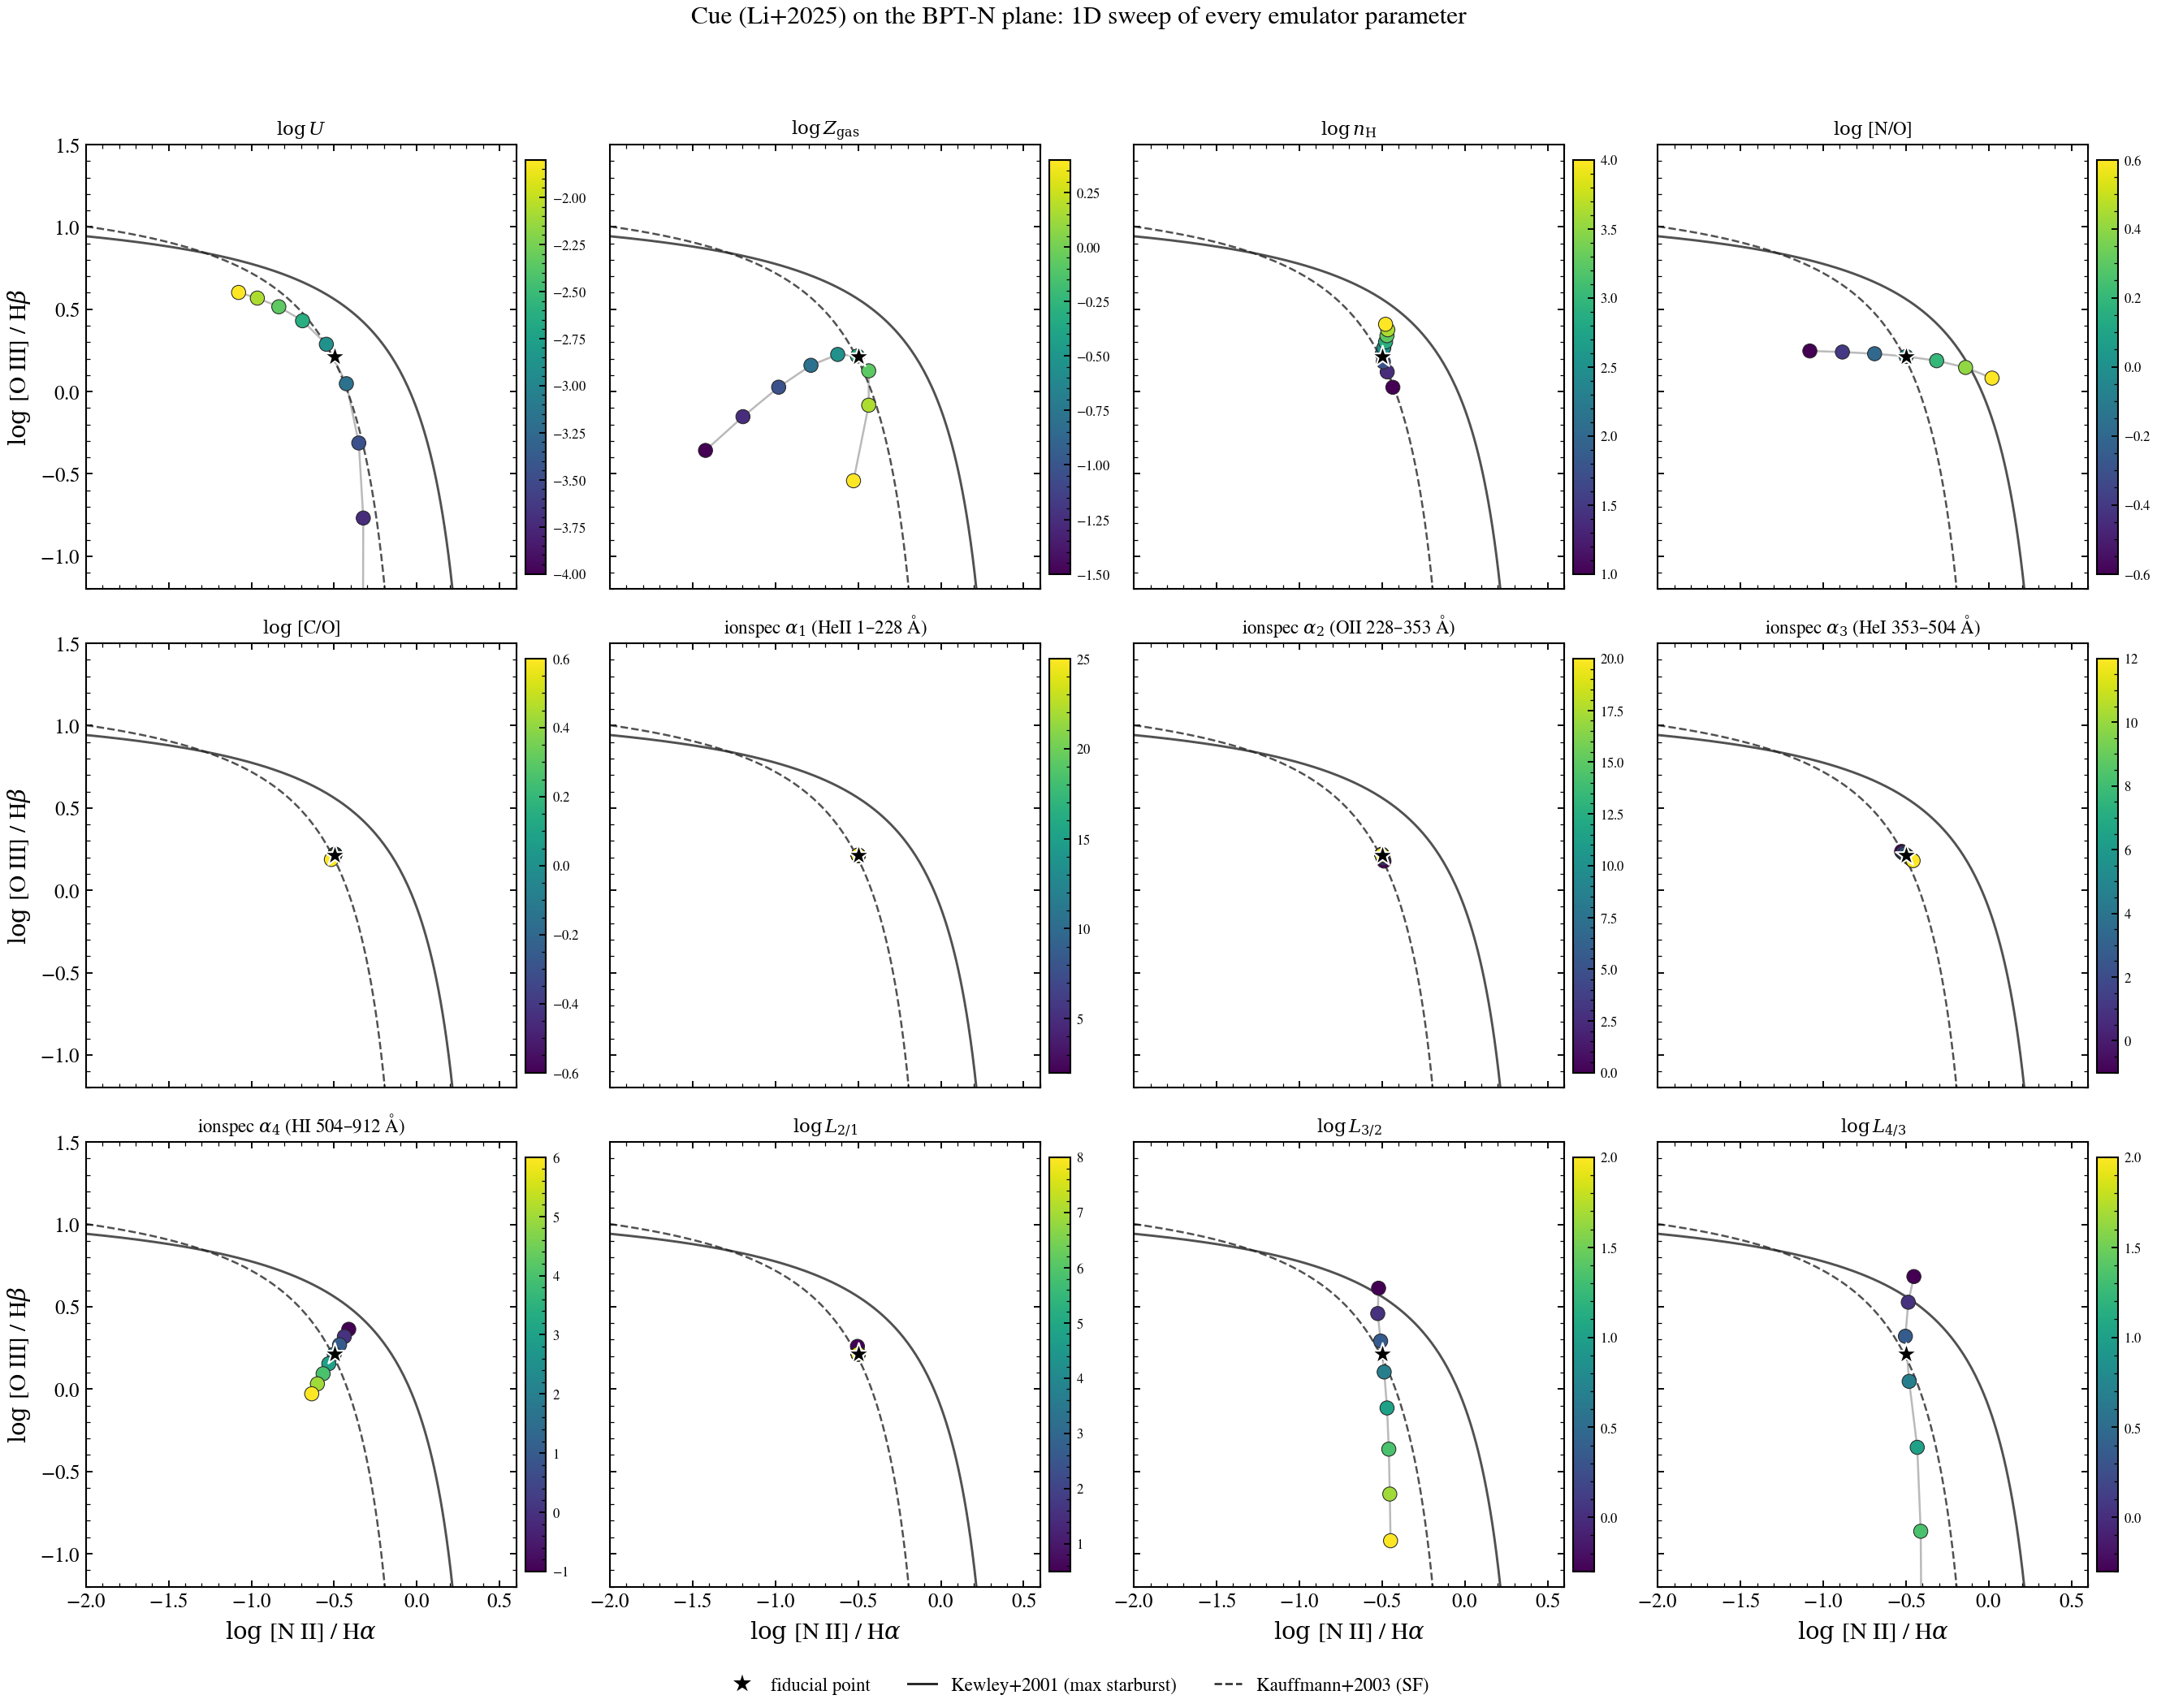
BPT with Cue: Every Knob, One Panel Each
Cue (Li+2025) emulates a 12-dimensional photoionization grid. This figure
sweeps each Cue parameter individually at fixed fiducial values for
the rest, showing how each one moves a single galaxy’s locus on the
BPT-N plane (log [O III]/Hβ vs log [N II]/Hα).
Three families, four panels each:
Gas conditions (top row):
log U,log Z_gas,log n_H,[N/O].Abundances + escape (middle row):
[C/O],log Z_gasoverlay with[N/O], pluslog U×log Z_gasmesh for context.Ionizing-spectrum slopes (bottom row):
ionspec_index{1..4}driving the four EUV segments (HeII, OII, HeI, HI).Ionizing-spectrum amplitudes:
ionspec_logLratio{1..3}.
Kewley+2001 (solid) and Kauffmann+2003 (dashed) demarcations on every panel for reference. Fiducial point shown as a black star.
from pathlib import Path

import jax
import matplotlib.pyplot as plt
import numpy as np

jax.config.update("jax_enable_x64", True)

from tengri import Fixed, Parameters, SEDModel, Uniform, load_ssp_data
from tengri.analysis.plotting import setup_style

setup_style()


def _find(rel: str) -> Path | None:
    for d in [Path(rel), Path("..") / rel, Path("../..") / rel, Path("../../..") / rel]:
        if d.exists():
            return d
    return None


SSP_PATH = _find("data/fsps_prsc_miles_chabrier.h5")
CUE_PATH = _find("data/cue_weights.npz")
if SSP_PATH is None or CUE_PATH is None:
    raise FileNotFoundError("SSP or Cue weights not found")

ssp = load_ssp_data(str(SSP_PATH))

# BPT-N line wavelengths (vacuum, Angstrom)
TARGETS = np.array([4862.7, 5008.2, 6564.6, 6585.3])  # Hβ, [O III], Hα, [N II]


# Fiducial values (typical young HII region)
FIDUCIAL = dict(
    neb_logU=-3.0,
    neb_logZ_gas=-0.3,
    neb_fesc=0.0,
    gas_logn=2.0,
    gas_logno=0.0,
    gas_logco=0.0,
    ionspec_index1=15.0,
    ionspec_index2=8.0,
    ionspec_index3=4.0,
    ionspec_index4=2.0,
    ionspec_logLratio1=4.0,
    ionspec_logLratio2=0.5,
    ionspec_logLratio3=0.5,
)

# All Cue knobs declared as free Uniform priors so they're registered in
# param_map; SEDModel is built ONCE so weights load + JIT compile happen
# only the first call. Subsequent predict_line_fluxes calls are ~1 ms.
spec = Parameters(
    sfh_tsnorm_log_peak_sfr=Fixed(1.0),
    sfh_tsnorm_peak_lbt_gyr=Fixed(0.05),
    sfh_tsnorm_width_gyr=Fixed(0.02),
    sfh_tsnorm_skew=Fixed(0.0),
    sfh_tsnorm_trunc=Fixed(0.5),
    met_logzsol=Fixed(-0.3),
    dust_tau_bc=Fixed(0.0),
    dust_tau_diff=Fixed(0.0),
    dust_slope=Fixed(-0.7),
    redshift=Fixed(0.05),
    neb_logU=Uniform(-4.5, -1.5),
    neb_logZ_gas=Uniform(-2.0, 0.5),
    neb_fesc=Fixed(0.0),
    gas_logn=Uniform(0.5, 4.5),
    gas_logno=Uniform(-1.0, 1.0),
    gas_logco=Uniform(-1.0, 1.0),
    ionspec_index1=Uniform(0.0, 30.0),
    ionspec_index2=Uniform(0.0, 25.0),
    ionspec_index3=Uniform(-1.0, 15.0),
    ionspec_index4=Uniform(-1.0, 8.0),
    ionspec_logLratio1=Uniform(0.0, 10.0),
    ionspec_logLratio2=Uniform(-0.5, 2.5),
    ionspec_logLratio3=Uniform(-0.5, 2.5),
    nebular="cue",
    cue_weights_path=str(CUE_PATH),
)
model = SEDModel(spec, ssp)


def _bpt(params: dict) -> tuple[float, float]:
    """Return (log [N II]/Hα, log [O III]/Hβ)."""
    f = np.asarray(model.predict_line_fluxes(params, target_wavelengths=TARGETS))
    f_hb, f_o3, f_ha, f_n2 = f
    if f_hb <= 0 or f_ha <= 0:
        return np.nan, np.nan
    return float(np.log10(f_n2 / f_ha)), float(np.log10(f_o3 / f_hb))


def _sweep(name: str, values: np.ndarray) -> np.ndarray:
    """Sweep one parameter through `values`, holding others at fiducial."""
    out = np.empty((len(values), 2))
    for i, v in enumerate(values):
        p = dict(FIDUCIAL)
        p[name] = float(v)
        out[i] = _bpt(p)
    return out


# Sweep ranges per parameter (chosen to bracket the registered prior)
SWEEPS = {
    r"$\log U$": ("neb_logU", np.linspace(-4.0, -1.8, 9)),
    r"$\log Z_{\rm gas}$": ("neb_logZ_gas", np.linspace(-1.5, 0.4, 9)),
    r"$\log n_{\rm H}$": ("gas_logn", np.linspace(1.0, 4.0, 9)),
    r"$\log\,$[N/O]": ("gas_logno", np.linspace(-0.6, 0.6, 7)),
    r"$\log\,$[C/O]": ("gas_logco", np.linspace(-0.6, 0.6, 7)),
    r"ionspec $\alpha_1$ (HeII 1–228 Å)": ("ionspec_index1", np.linspace(2.0, 25.0, 8)),
    r"ionspec $\alpha_2$ (OII 228–353 Å)": ("ionspec_index2", np.linspace(0.0, 20.0, 8)),
    r"ionspec $\alpha_3$ (HeI 353–504 Å)": ("ionspec_index3", np.linspace(-1.0, 12.0, 8)),
    r"ionspec $\alpha_4$ (HI 504–912 Å)": ("ionspec_index4", np.linspace(-1.0, 6.0, 8)),
    r"$\log L_{2/1}$": ("ionspec_logLratio1", np.linspace(0.5, 8.0, 8)),
    r"$\log L_{3/2}$": ("ionspec_logLratio2", np.linspace(-0.3, 2.0, 8)),
    r"$\log L_{4/3}$": ("ionspec_logLratio3", np.linspace(-0.3, 2.0, 8)),
}

# Compute fiducial point
fid_xy = _bpt(FIDUCIAL)

# Compute all sweeps
results = {label: (key, vals, _sweep(key, vals)) for label, (key, vals) in SWEEPS.items()}


# --- Demarcations ---------------------------------------------------
def kewley01(x):
    return 0.61 / (x - 0.47) + 1.19


def kauff03(x):
    return 0.61 / (x - 0.05) + 1.30


nh_grid = np.linspace(-2.0, 0.45, 200)


# --- Plot 3×4 panels ------------------------------------------------
fig, axes = plt.subplots(3, 4, figsize=(18, 14), sharex=True, sharey=True)
axes_flat = axes.flatten()


def _draw_demarc(ax):
    m = nh_grid < 0.47
    ax.plot(nh_grid[m], kewley01(nh_grid[m]), "-", color="0.15", lw=1.4, alpha=0.8)
    m2 = nh_grid < 0.05
    ax.plot(nh_grid[m2], kauff03(nh_grid[m2]), "--", color="0.15", lw=1.2, alpha=0.8)


for ax, (label, (key, vals, xy)) in zip(axes_flat, results.items()):
    cmap = plt.cm.viridis
    n = len(vals)
    # Plot connecting line + colored markers per parameter value
    ax.plot(xy[:, 0], xy[:, 1], "-", color="0.55", lw=1.2, alpha=0.6, zorder=2)
    sc = ax.scatter(
        xy[:, 0], xy[:, 1], c=vals, cmap=cmap, s=70, edgecolor="0.15", lw=0.5,
        zorder=4, vmin=vals.min(), vmax=vals.max(),
    )
    # Fiducial as black star for reference
    ax.scatter([fid_xy[0]], [fid_xy[1]], marker="*", s=180, color="black",
               edgecolor="white", lw=1.0, zorder=5, label="fiducial")
    _draw_demarc(ax)
    ax.set_title(label, fontsize=11, pad=6)
    cbar = fig.colorbar(sc, ax=ax, fraction=0.045, pad=0.02)
    cbar.ax.tick_params(labelsize=8)

# Axis labels only on outer panels (sharex/sharey)
for ax in axes[-1, :]:
    ax.set_xlabel(r"$\log\,$[N II] / H$\alpha$")
for ax in axes[:, 0]:
    ax.set_ylabel(r"$\log\,$[O III] / H$\beta$")
for ax in axes_flat:
    ax.set_xlim(-2.0, 0.6)
    ax.set_ylim(-1.2, 1.5)

# Single global legend (just the fiducial marker + demarcations)
import matplotlib.lines as mlines
fid_handle = mlines.Line2D([], [], marker="*", color="black", markersize=14,
                            markeredgecolor="white", lw=0, label="fiducial point")
kewley_handle = mlines.Line2D([], [], color="0.15", lw=1.4, label="Kewley+2001 (max starburst)")
kauff_handle = mlines.Line2D([], [], color="0.15", lw=1.2, ls="--", label="Kauffmann+2003 (SF)")
fig.legend(handles=[fid_handle, kewley_handle, kauff_handle],
           loc="lower center", ncol=3, frameon=False, fontsize=11,
           bbox_to_anchor=(0.5, -0.005))

fig.suptitle(
    "Cue (Li+2025) on the BPT-N plane: 1D sweep of every emulator parameter",
    fontsize=15, y=0.995,
)
fig.tight_layout(rect=[0, 0.02, 1, 0.97])
plt.savefig("plot_bpt_cue_flexibility.png", dpi=150, bbox_inches="tight")
plt.show()