Note
Go to the end to download the full example code.
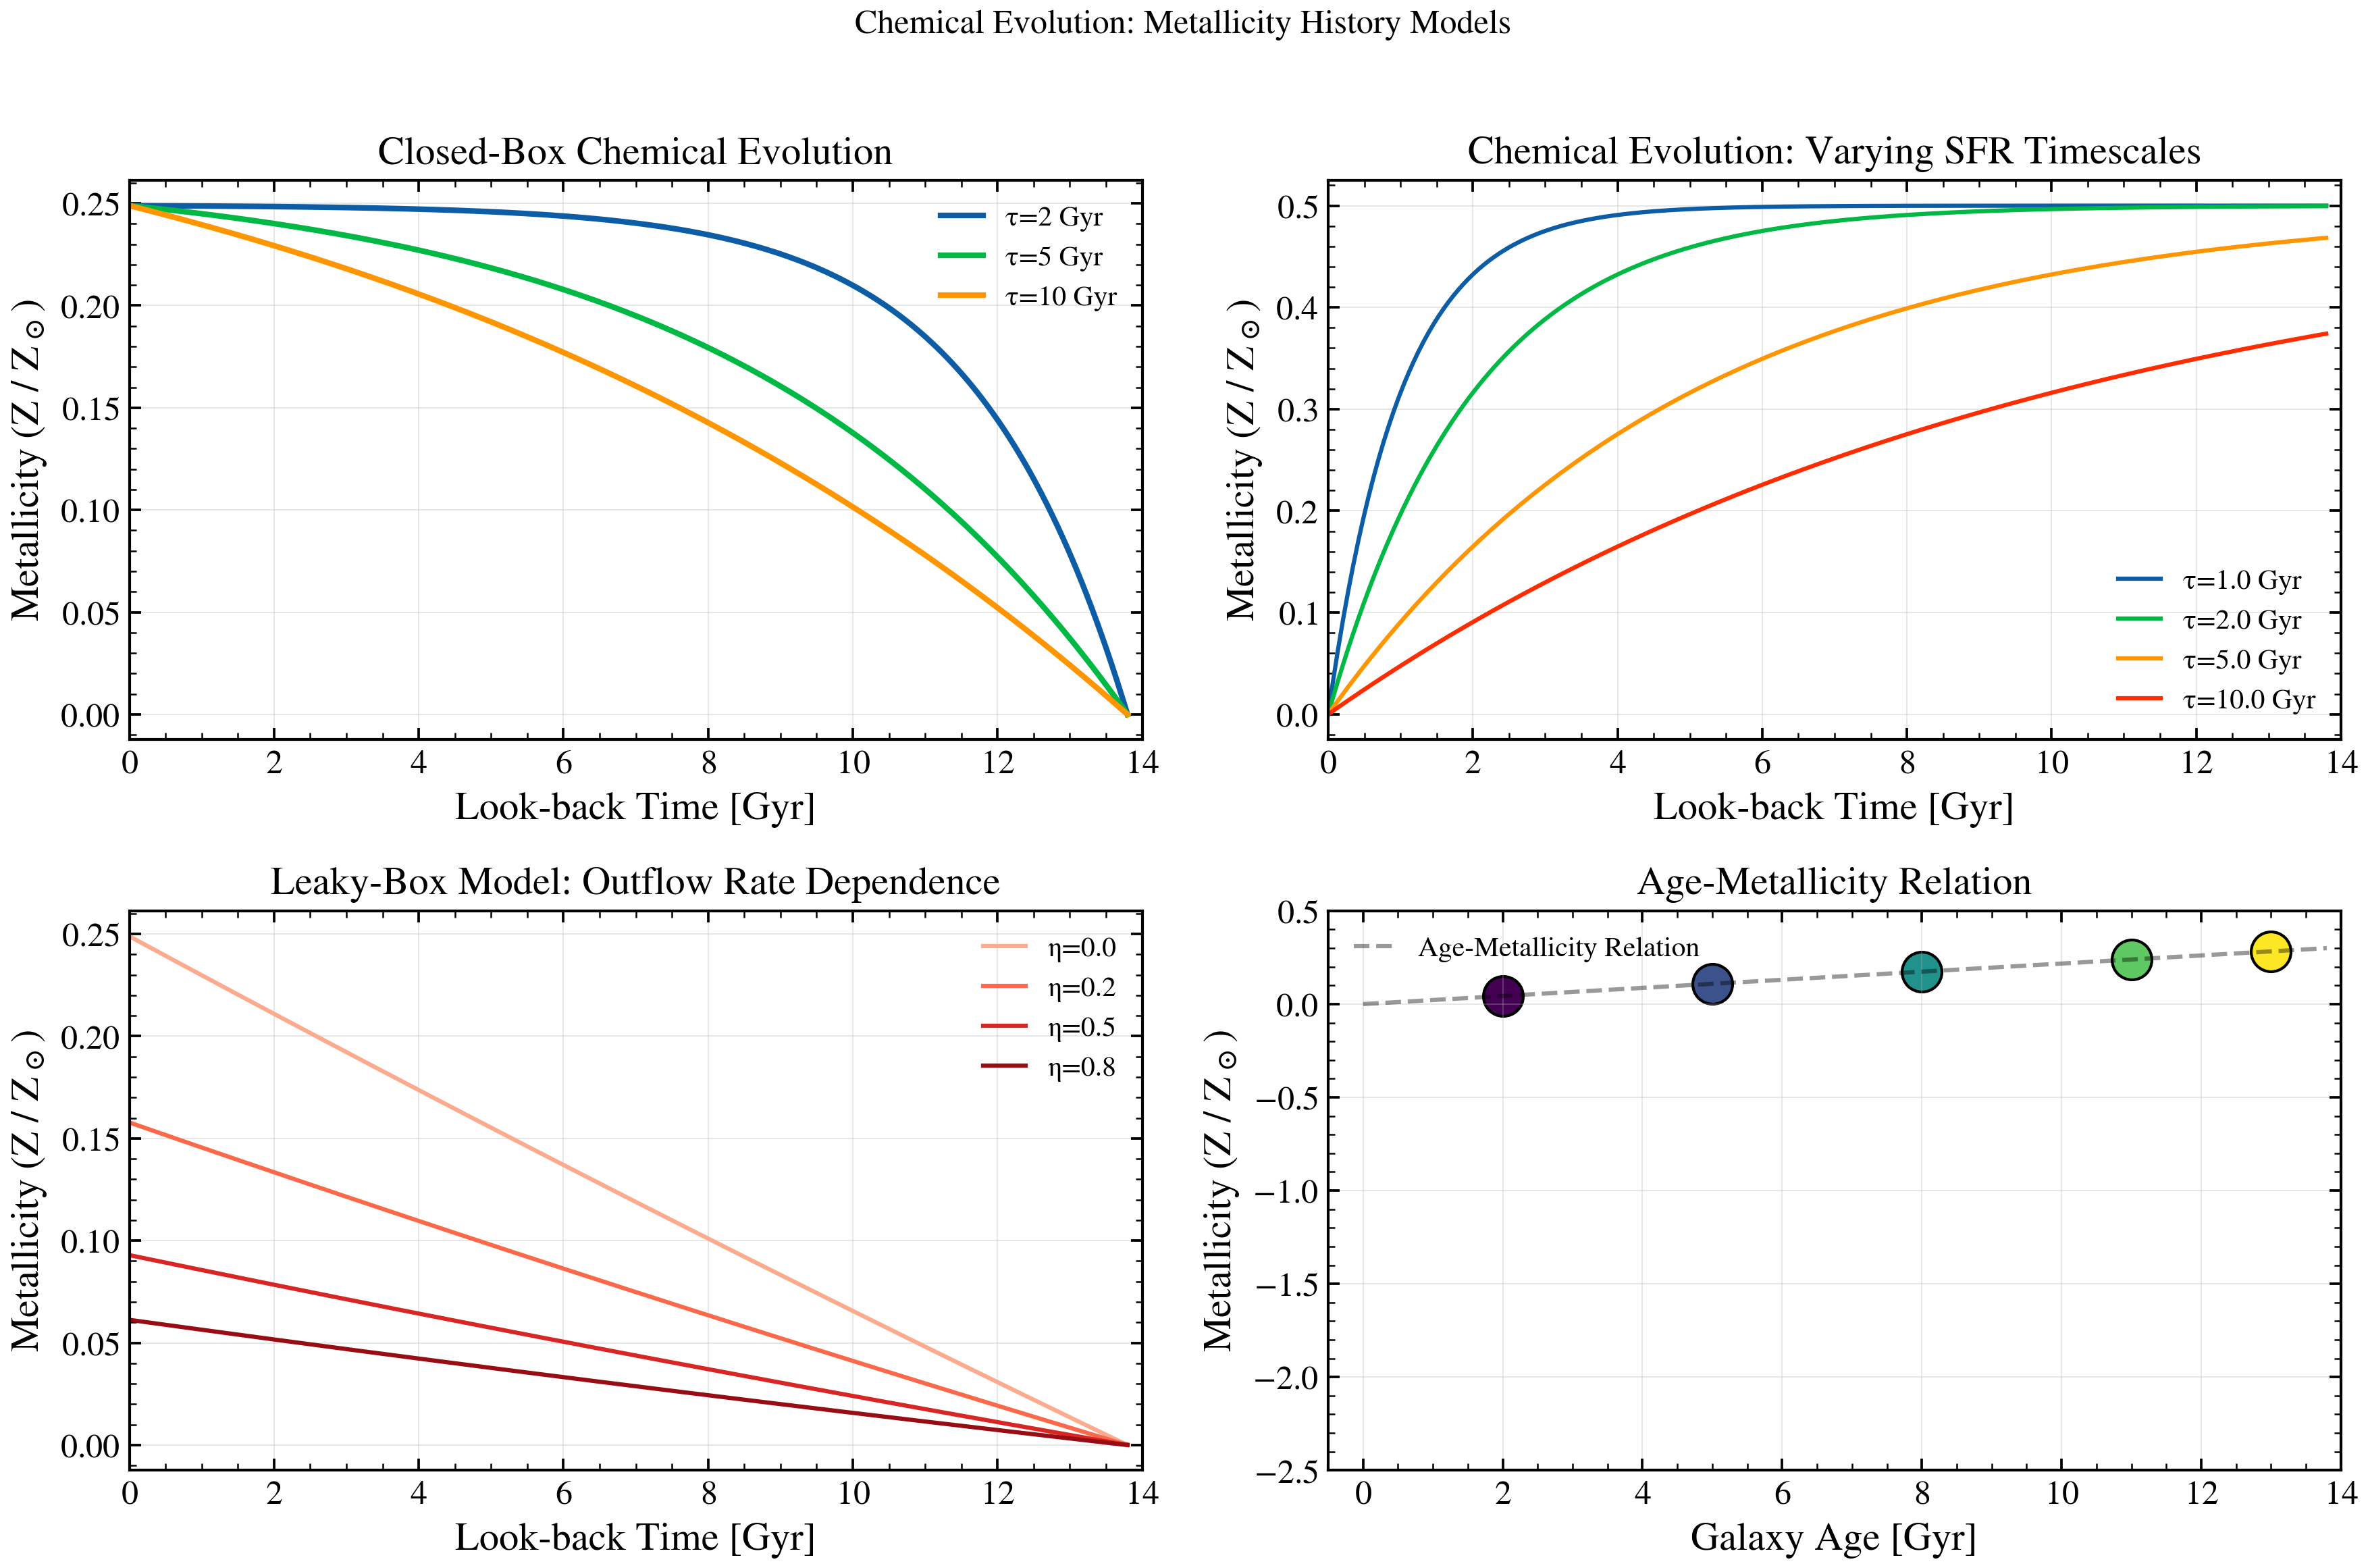
Chemical Evolution: Metallicity History Models
Plot metallicity evolution Z(t) from closed-box and leaky-box chemical evolution models. Shows how star formation history and gas outflows shape the history of metal enrichment in galaxies.
import matplotlib.pyplot as plt
import numpy as np

from tengri.analysis.plotting import setup_style
from tengri.components.sfh import closed_box_metallicity
from tengri.utils.cosmology import age_at_z0

setup_style()

fig, axes = plt.subplots(2, 2, figsize=(12, 8))

# Time axis: look-back time in Gyr (cosmology-dependent age)
age_uni_gyr = float(age_at_z0())
t_gyr = np.linspace(0, age_uni_gyr, 200)
# Convert to years for the function (if needed)
t_yr = t_gyr * 1e9

# Solar metallicity
Z_sun = 10.0 ** (-1.848)

# --- Panel 1: Closed-box model with different calibrations ---
ax = axes[0, 0]

# Closed-box metallicity: Z(t) = Z_sun * log(1 / (1 - x))
# where x = (M_recycled + M_ejected) / M_initial is cumulative mass fraction
# For a simple closed box, x scales with (time / age_max)^alpha

# closed_box_metallicity takes (age_yr, sfr, ...) and returns log10(Z/Z_sun).
# Convention: age_yr is LOOKBACK time (youngest first); sfr is the SFH on that grid.
age_from_start = age_uni_gyr - t_gyr  # time since formation
for tau_gyr, y_label in [(2.0, "τ=2 Gyr"), (5.0, "τ=5 Gyr"), (10.0, "τ=10 Gyr")]:
    sfr = np.exp(-age_from_start / tau_gyr)
    log_z = closed_box_metallicity(t_yr, sfr, yield_y=0.03, eta_outflow=0.0, f_gas_init=0.9)
    ax.plot(t_gyr, 10.0 ** np.array(log_z), lw=2.0, label=y_label)

ax.set_xlabel("Look-back Time [Gyr]")
ax.set_ylabel(r"Metallicity (Z / Z$_\odot$)")
ax.set_title("Closed-Box Chemical Evolution")
ax.legend(fontsize=10, frameon=False)
ax.grid(True, alpha=0.3)
ax.set_xlim(0, 14)

# --- Panel 2: Varying SFR shapes (implicit via parametric SFH) ---
ax = axes[0, 1]

# Age grid
age_gyr = age_uni_gyr  # Galaxy age
tau_values = [1.0, 2.0, 5.0, 10.0]  # Exponential timescales in Gyr

for tau_gyr in tau_values:
    # SFH: PSI(t) ∝ exp(-t / tau)
    # Metal abundance tracks cumulative stellar mass formed
    cum_mass = 1.0 - np.exp(-t_gyr / tau_gyr)
    z_evolve = Z_sun * 0.5 * cum_mass  # Simplified enrichment

    ax.plot(t_gyr, z_evolve / Z_sun, lw=1.5, label=f"τ={tau_gyr:.1f} Gyr")

ax.set_xlabel("Look-back Time [Gyr]")
ax.set_ylabel(r"Metallicity (Z / Z$_\odot$)")
ax.set_title("Chemical Evolution: Varying SFR Timescales")
ax.legend(fontsize=10, frameon=False)
ax.grid(True, alpha=0.3)
ax.set_xlim(0, 14)

# --- Panel 3: Leaky-box model (outflow dependence) ---
ax = axes[1, 0]

# Leaky-box: Z(t) = Z_sun * (1 - eta) * log(1/(1-x)) where eta = outflow rate
# Higher eta → more metal loss → lower Z at given mass
outflow_rates = [0.0, 0.2, 0.5, 0.8]  # eta: 0 = closed, 1 = maximal outflow
colors = plt.cm.Reds(np.linspace(0.3, 0.9, len(outflow_rates)))

sfr_const = np.ones_like(t_yr)  # constant SFR
for eta, color in zip(outflow_rates, colors):
    log_z = closed_box_metallicity(t_yr, sfr_const, yield_y=0.03, eta_outflow=eta, f_gas_init=0.9)
    ax.plot(t_gyr, 10.0 ** np.array(log_z), lw=1.5, color=color, label=f"η={eta:.1f}")

ax.set_xlabel("Look-back Time [Gyr]")
ax.set_ylabel(r"Metallicity (Z / Z$_\odot$)")
ax.set_title("Leaky-Box Model: Outflow Rate Dependence")
ax.legend(fontsize=10, frameon=False)
ax.grid(True, alpha=0.3)
ax.set_xlim(0, 14)

# --- Panel 4: Metallicity gradient (radial dependence via age-metallicity) ---
ax = axes[1, 1]

# Simpler representation: age-metallicity relation across a disk
# Inner regions: older, lower metallicity (early assembly)
# Outer regions: younger, higher metallicity (ongoing star formation)

ages_gyr = np.array([2.0, 5.0, 8.0, 11.0, 13.0])
colors_amr = plt.cm.viridis(np.linspace(0, 1, len(ages_gyr)))

for age_gyr, color in zip(ages_gyr, colors_amr):
    # Mock Z(age) curve: Z increases with formation time
    z_amr = (
        Z_sun * (age_gyr / age_uni_gyr) * 0.3
    )  # Normalized to ~0.3 Z_sun at age age_uni_gyr Gyr
    ax.scatter(age_gyr, z_amr / Z_sun, s=200, color=color, edgecolors="k", linewidth=1.0)

# Interpolate
ages_interp = np.linspace(0, age_uni_gyr, 100)
z_interp = Z_sun * (ages_interp / age_uni_gyr) * 0.3
ax.plot(ages_interp, z_interp / Z_sun, "k--", lw=1.5, alpha=0.4, label="Age-Metallicity Relation")

ax.set_xlabel("Galaxy Age [Gyr]")
ax.set_ylabel(r"Metallicity (Z / Z$_\odot$)")
ax.set_title("Age-Metallicity Relation")
ax.legend(fontsize=10, frameon=False)
ax.grid(True, alpha=0.3)
ax.set_xlim(-0.5, 14)
ax.set_ylim(-2.5, 0.5)

fig.suptitle("Chemical Evolution: Metallicity History Models", fontsize=12)
fig.tight_layout(rect=[0, 0, 1, 0.97])
plt.savefig("plot_chemical_evolution.png", dpi=100, bbox_inches="tight")
plt.show()