Note
Go to the end to download the full example code.
Polar Dust: Temperature Sweep in AGN Torus
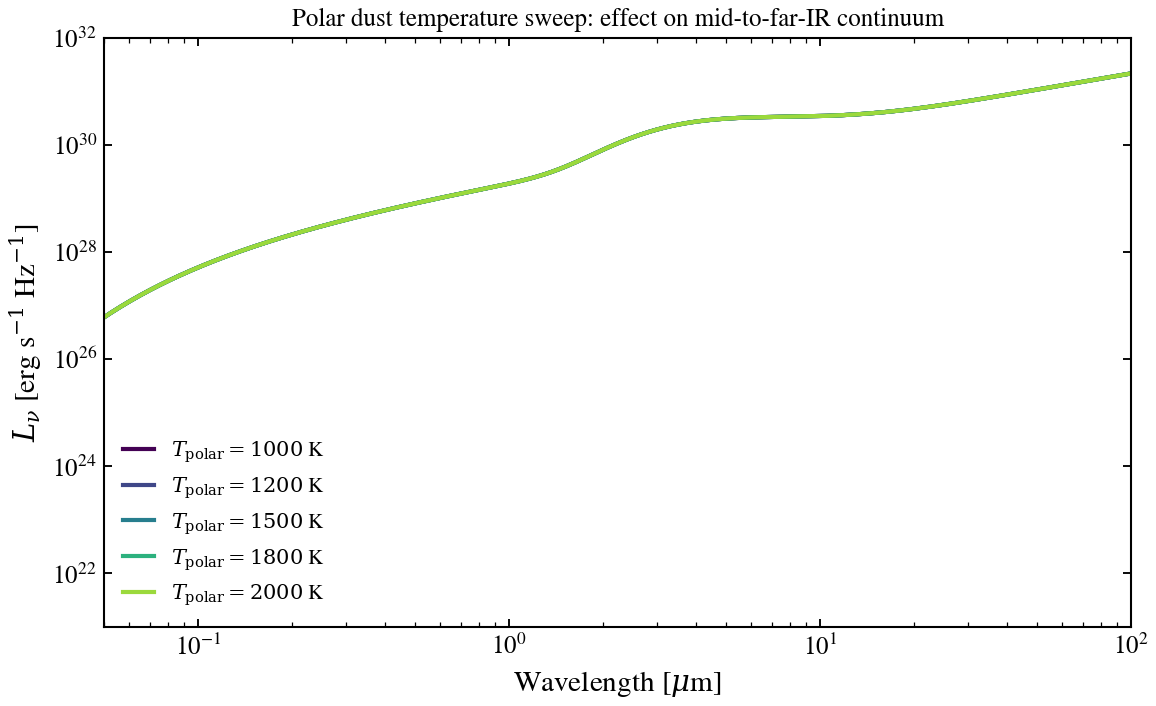
Sweep polar-dust temperature from 1000 to 2000 K. The polar component is a narrow warm cone decoupled from the equatorial torus; hotter polar dust enhances the mid-IR bump in edge-on systems.
import jax.numpy as jnp
import matplotlib.pyplot as plt
import numpy as np

from tengri.analysis.plotting import setup_style
from tengri.components.agn import powerlaw_disc, simple_torus

setup_style()

# Wavelength grid: optical to far-IR
wavelength = jnp.logspace(np.log10(100), np.log10(1e6), 512)
wave_um = np.array(wavelength) / 1e4


def _planck_l_nu(wave, temp_k):
    """Planck function for dust thermal emission [erg/s/Hz]."""
    h_cgs = 6.62607015e-27  # erg·s
    c_cgs = 2.99792458e10  # cm/s
    kb_cgs = 1.380649e-16  # erg/K
    nu = c_cgs / (wave * 1e-8)  # convert to Hz
    hnu = h_cgs * nu
    kbt = kb_cgs * temp_k

    exponent = hnu / kbt
    exp_fac = jnp.exp(jnp.minimum(exponent, 100.0))

    return (2.0 * h_cgs * nu**3 / c_cgs**2) / (exp_fac - 1.0)


# Create figure with single panel
fig, ax = plt.subplots(figsize=(8, 5))

# Polar dust temperature values to sweep (Kelvin)
temp_values = [1000.0, 1200.0, 1500.0, 1800.0, 2000.0]

# Generate colors from colormap
colors = plt.cm.viridis(np.linspace(0.0, 0.85, len(temp_values)))

# Base disc and equatorial torus
log_lbol = 11.0
l_disc = powerlaw_disc(wavelength, agn_log_lbol=log_lbol, agn_slope=-1.5)
l_equat_torus = simple_torus(wavelength, agn_log_lbol=log_lbol, agn_torus_temp=1200.0)

# Sweep polar dust temperature
for temp_polar, color in zip(temp_values, colors):
    # Polar dust luminosity: fixed geometry coverage, vary Planck temperature
    polar_coverage = 0.15  # ~15% of luminosity from polar dust
    l_polar = polar_coverage * 3e31 * _planck_l_nu(wavelength, temp_polar)
    l_total = np.array(l_disc + l_equat_torus + l_polar)
    label = rf"$T_{{\mathrm{{polar}}}} = {temp_polar:.0f}$ K"
    ax.loglog(wave_um, l_total, lw=2.0, color=color, label=label)

ax.set_xlabel(r"Wavelength [$\mu$m]")
ax.set_ylabel(r"$L_\nu$ [erg s$^{-1}$ Hz$^{-1}$]")
ax.set_title("Polar dust temperature sweep: effect on mid-to-far-IR continuum", fontsize=12)
ax.legend(fontsize=10, frameon=False, loc="best")
# Breathing room in axis limits
ax.set_xlim(0.05, 100)
ax.set_ylim(1e21, 1e32)
ax.grid(False)

fig.tight_layout()
plt.savefig("plot_agn_polar_dust_temp_sweep.png", dpi=150, bbox_inches="tight")
plt.show()