Note
Go to the end to download the full example code.
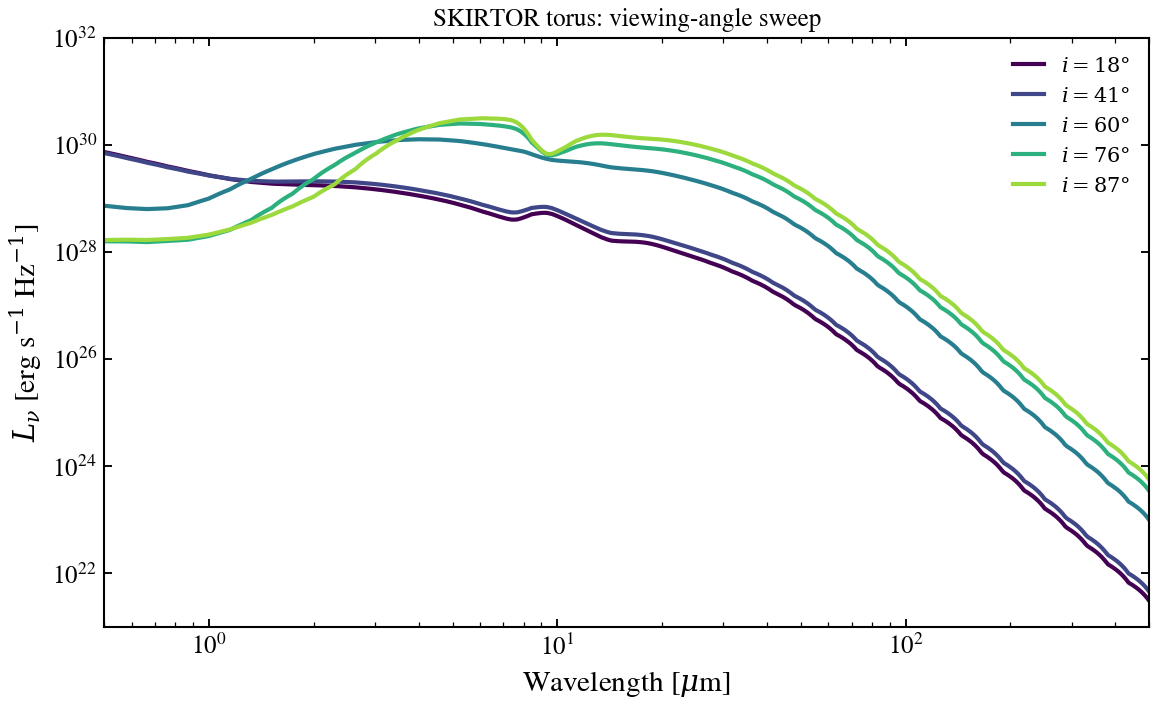
SKIRTOR Torus: Viewing Angle Sweep
Sweep agn_cos_inc from 0.95 (face-on) to 0.05 (edge-on) and watch the infrared emission profile change as the line of sight cuts through more of the SKIRTOR torus.
from pathlib import Path

import jax.numpy as jnp
import matplotlib.pyplot as plt
import numpy as np

# Locate SKIRTOR grid file
_grid_path = None
for p in [
    Path("data/skirtor_templates_v3.h5"),
    Path("../data/skirtor_templates_v3.h5"),
    Path("../../data/skirtor_templates_v3.h5"),
    Path("../../../data/skirtor_templates_v3.h5"),
    Path("data/skirtor_templates_v2.h5"),
    Path("../data/skirtor_templates_v2.h5"),
    Path("../../data/skirtor_templates_v2.h5"),
    Path("../../../data/skirtor_templates_v2.h5"),
]:
    if p.exists():
        _grid_path = str(p)
        break

if _grid_path is None:
    raise SystemExit(
        "Skipping: SKIRTOR grid not found. Run: python scripts/download_skirtor_templates.py"
    )

from tengri.analysis.plotting import setup_style
from tengri.components.agn import create_skirtor_from_grid

setup_style()

# Load the SKIRTOR interpolator
skirtor_fn = create_skirtor_from_grid(_grid_path)

# Wavelength grid: 0.5 - 500 micron (IR torus dominated)
wavelength = jnp.logspace(np.log10(5e3), np.log10(5e6), 512)
wave_um = np.array(wavelength) / 1e4

# Cosine of inclination values to sweep
cos_inc_values = [0.95, 0.75, 0.50, 0.25, 0.05]

# Create figure with single panel
fig, ax = plt.subplots(figsize=(8, 5))

# Generate colors from colormap
colors = plt.cm.viridis(np.linspace(0.0, 0.85, len(cos_inc_values)))

# Fixed parameters: typical values
agn_log_lbol = 11.0
agn_tau_skirtor = 7.0
agn_p_skirtor = 1.0  # Radial power
agn_q_skirtor = 1.0
agn_oa_skirtor = 40.0

# Sweep viewing angle
for cos_inc, color in zip(cos_inc_values, colors):
    try:
        inc_deg = np.degrees(np.arccos(cos_inc))
        sed = skirtor_fn(
            wavelength,
            agn_log_lbol=agn_log_lbol,
            agn_tau_skirtor=agn_tau_skirtor,
            agn_p_skirtor=agn_p_skirtor,
            agn_q_skirtor=agn_q_skirtor,
            agn_oa_skirtor=agn_oa_skirtor,
            agn_cos_inc=cos_inc,
        )
        ax.loglog(wave_um, np.array(sed), lw=2.0, color=color, label=rf"$i = {inc_deg:.0f}°$")
    except Exception:
        continue

ax.set_xlabel(r"Wavelength [$\mu$m]")
ax.set_ylabel(r"$L_\nu$ [erg s$^{-1}$ Hz$^{-1}$]")
ax.set_title("SKIRTOR torus: viewing-angle sweep", fontsize=12)
ax.legend(fontsize=10, frameon=False, loc="best")
ax.set_xlim(0.5, 500)
ax.set_ylim(1e21, 1e32)
ax.grid(False)

fig.tight_layout()
plt.savefig("plot_agn_cos_inc_sweep.png", dpi=150, bbox_inches="tight")
plt.show()