Note
Go to the end to download the full example code.
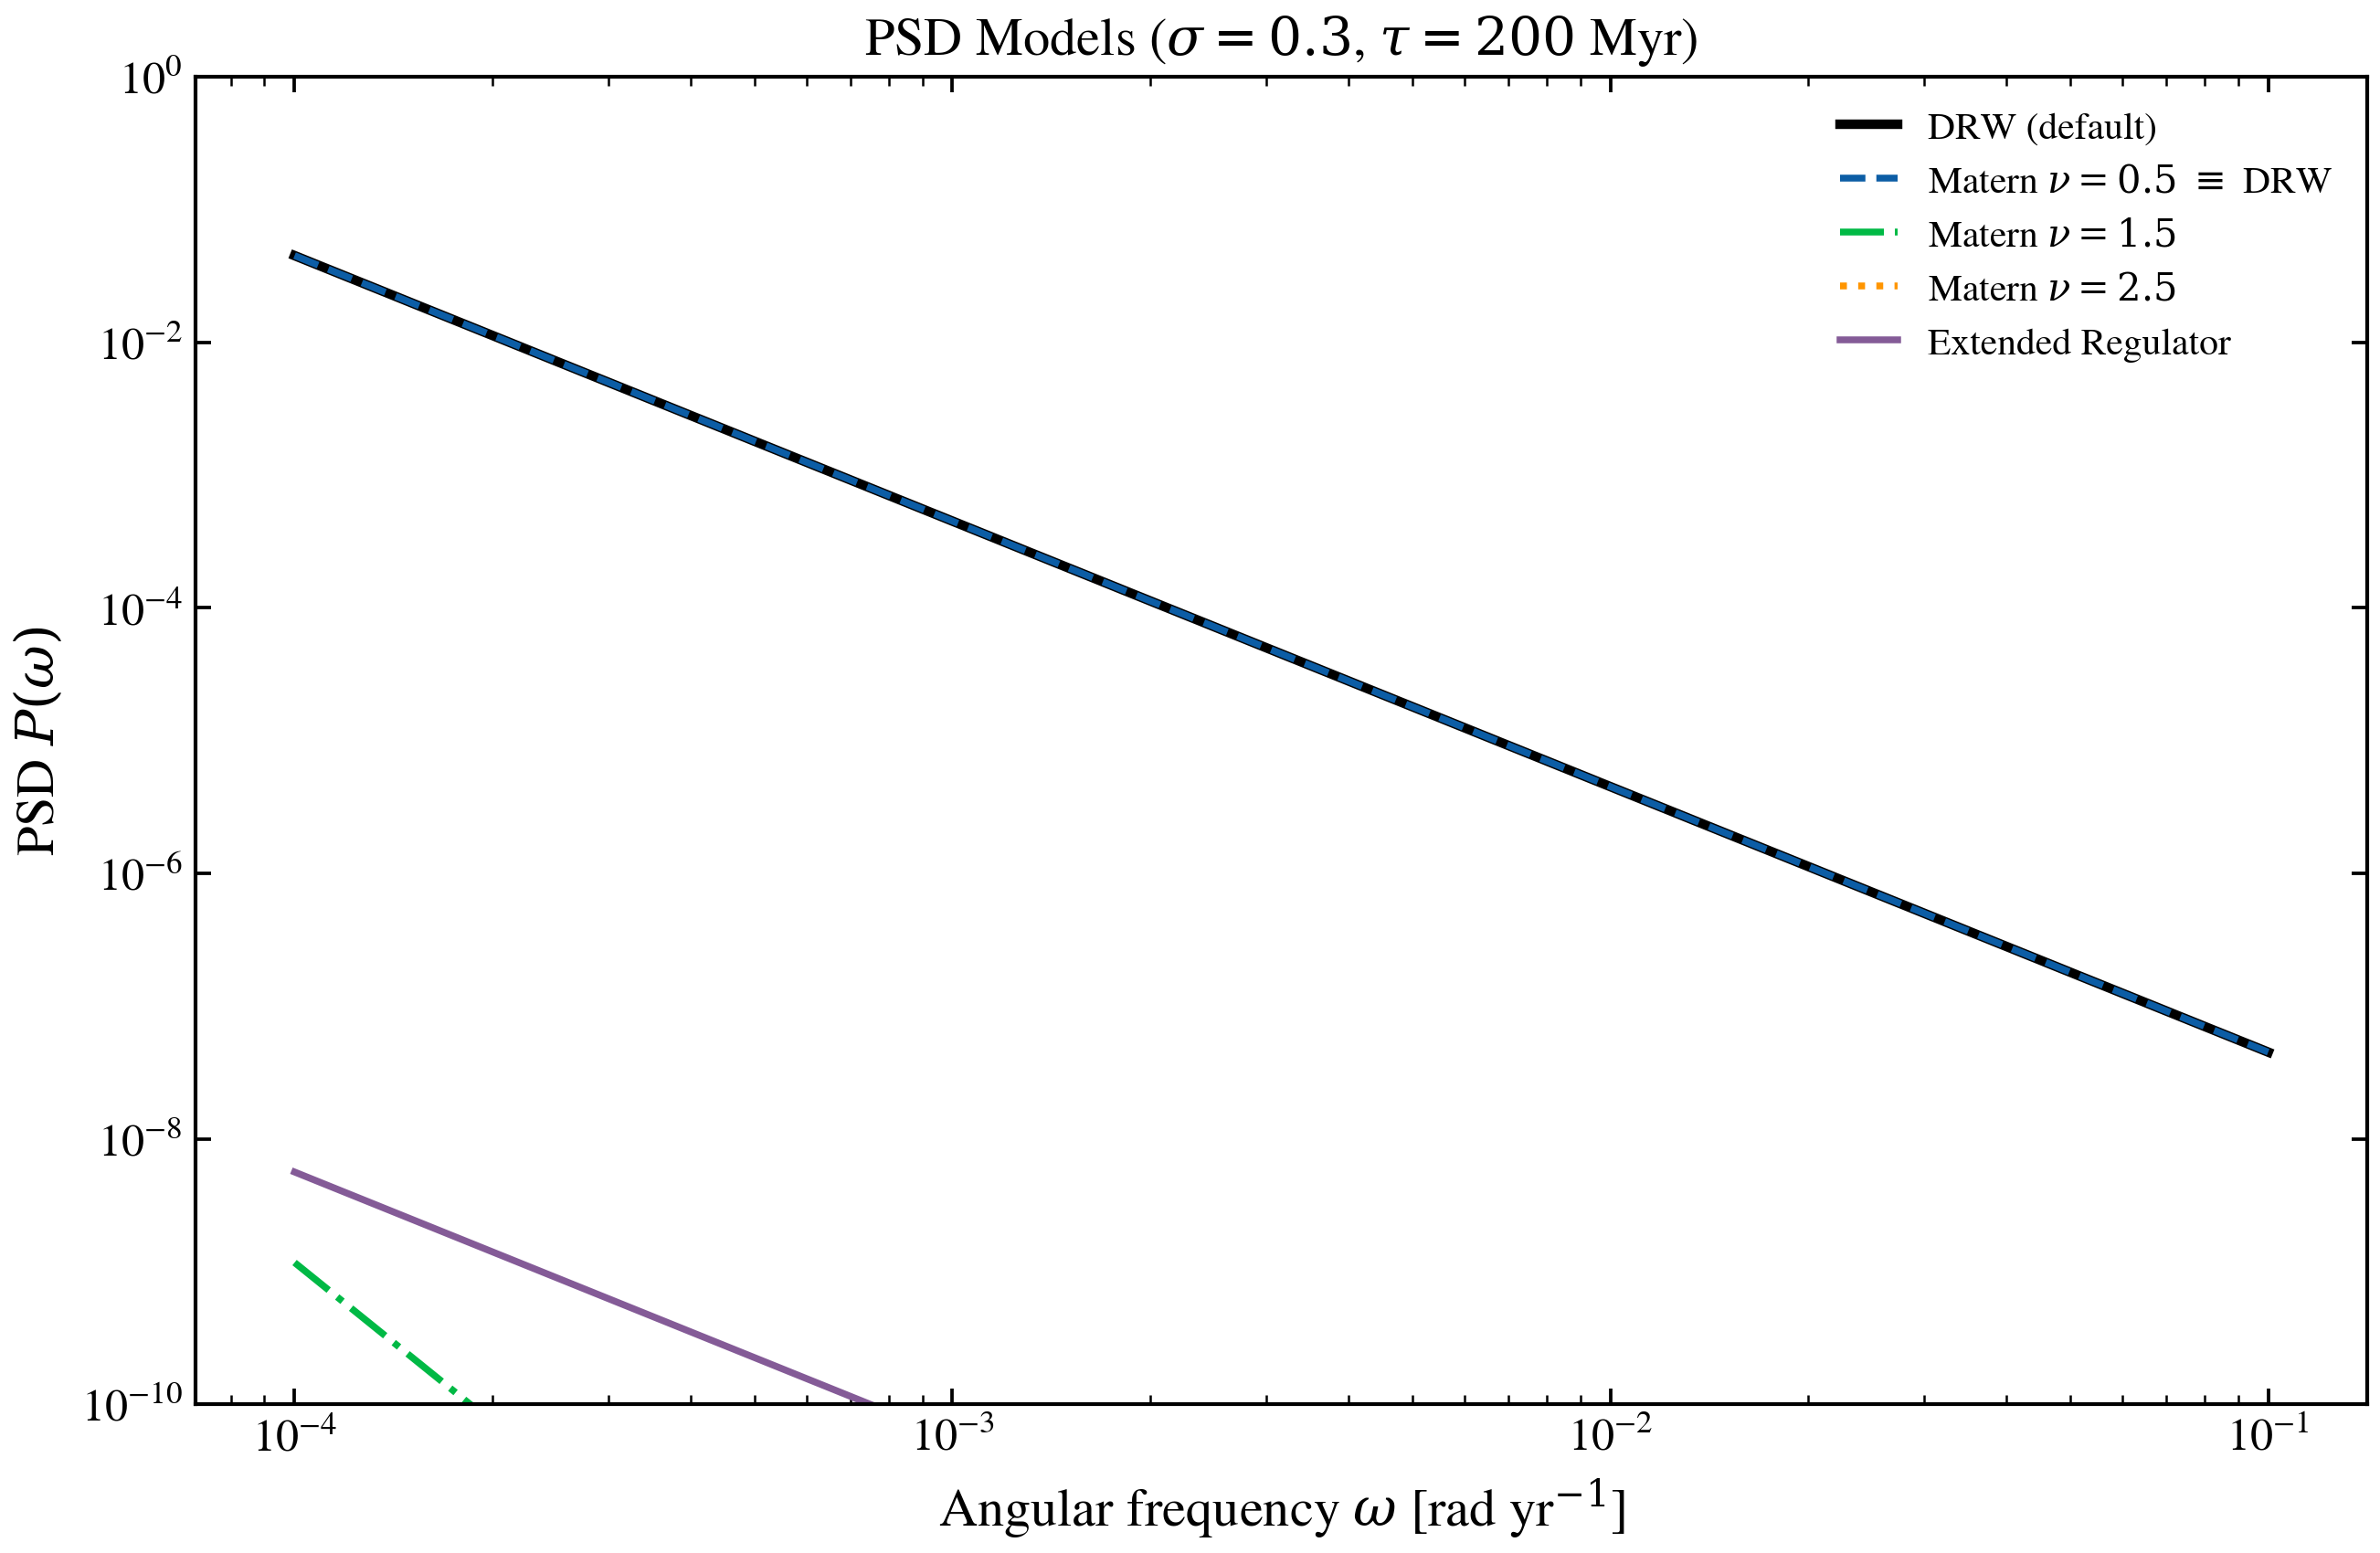
Alternative PSD Models
Compare the three PSD models available for stochastic SFHs: the default Damped Random Walk (DRW/Lorentzian), the Matern covariance family, and the extended regulator model. No SSP data required.
import jax.numpy as jnp
import matplotlib.pyplot as plt
import numpy as np

from tengri.analysis.plotting import setup_style
from tengri.sfh import psd_drw

setup_style()
Frequency grid (angular frequency in rad/yr)
omega = jnp.logspace(-4, -1, 500)

# DRW parameters
sigma = 0.3
tau_yr = 200e6  # 200 Myr
DRW (Lorentzian) — the default model
drw = psd_drw(omega, psd_sigma=sigma, psd_tau_yr=tau_yr)

fig, ax = plt.subplots(figsize=(9, 6))
ax.loglog(np.array(omega), np.array(drw), "k-", lw=2.5, label="DRW (default)")

# Matern family: nu=0.5 recovers DRW, higher nu gives smoother fields
try:
    from tengri.sfh import psd_matern

    # Convert DRW params to Matern parameterization
    variance = 0.5 * sigma**2  # DRW stationary variance
    length_scale = tau_yr

    for nu, ls, color in [(0.5, "--", "C0"), (1.5, "-.", "C1"), (2.5, ":", "C2")]:
        psd_m = psd_matern(omega, variance=variance, length_scale=length_scale, nu=nu)
        suffix = r" $\equiv$ DRW" if nu == 0.5 else ""
        ax.loglog(
            np.array(omega),
            np.array(psd_m),
            ls=ls,
            lw=1.8,
            color=color,
            label=rf"Matern $\nu={nu}${suffix}",
        )
except ImportError:
    pass  # psd_matern not available

# Extended regulator model (Tacchella+2020)
try:
    from tengri.sfh import psd_extended_regulator

    # Cyclic frequency f = omega / (2*pi)
    f = omega / (2.0 * jnp.pi)
    psd_reg = psd_extended_regulator(
        f,
        s_reg=0.3,
        tau_in=300e6,
        tau_eq=50e6,
        s_dyn=0.15,
        tau_dyn=20e6,
    )
    ax.loglog(
        np.array(omega),
        np.array(psd_reg),
        "-",
        lw=1.8,
        color="C4",
        label="Extended Regulator",
    )
except ImportError:
    pass  # psd_extended_regulator not available

# Annotate and finalize
ax.set_xlabel(r"Angular frequency $\omega$ [rad yr$^{-1}$]")
ax.set_ylabel(r"PSD $P(\omega)$")
ax.set_title(r"PSD Models ($\sigma=0.3$, $\tau=200$ Myr)")
ax.set_ylim(1e-10, 1e0)
ax.legend(frameon=False, fontsize=10)
fig.tight_layout()

plt.savefig("plot_psd_alternatives.png", dpi=150, bbox_inches="tight")
plt.show()