Note
Go to the end to download the full example code.
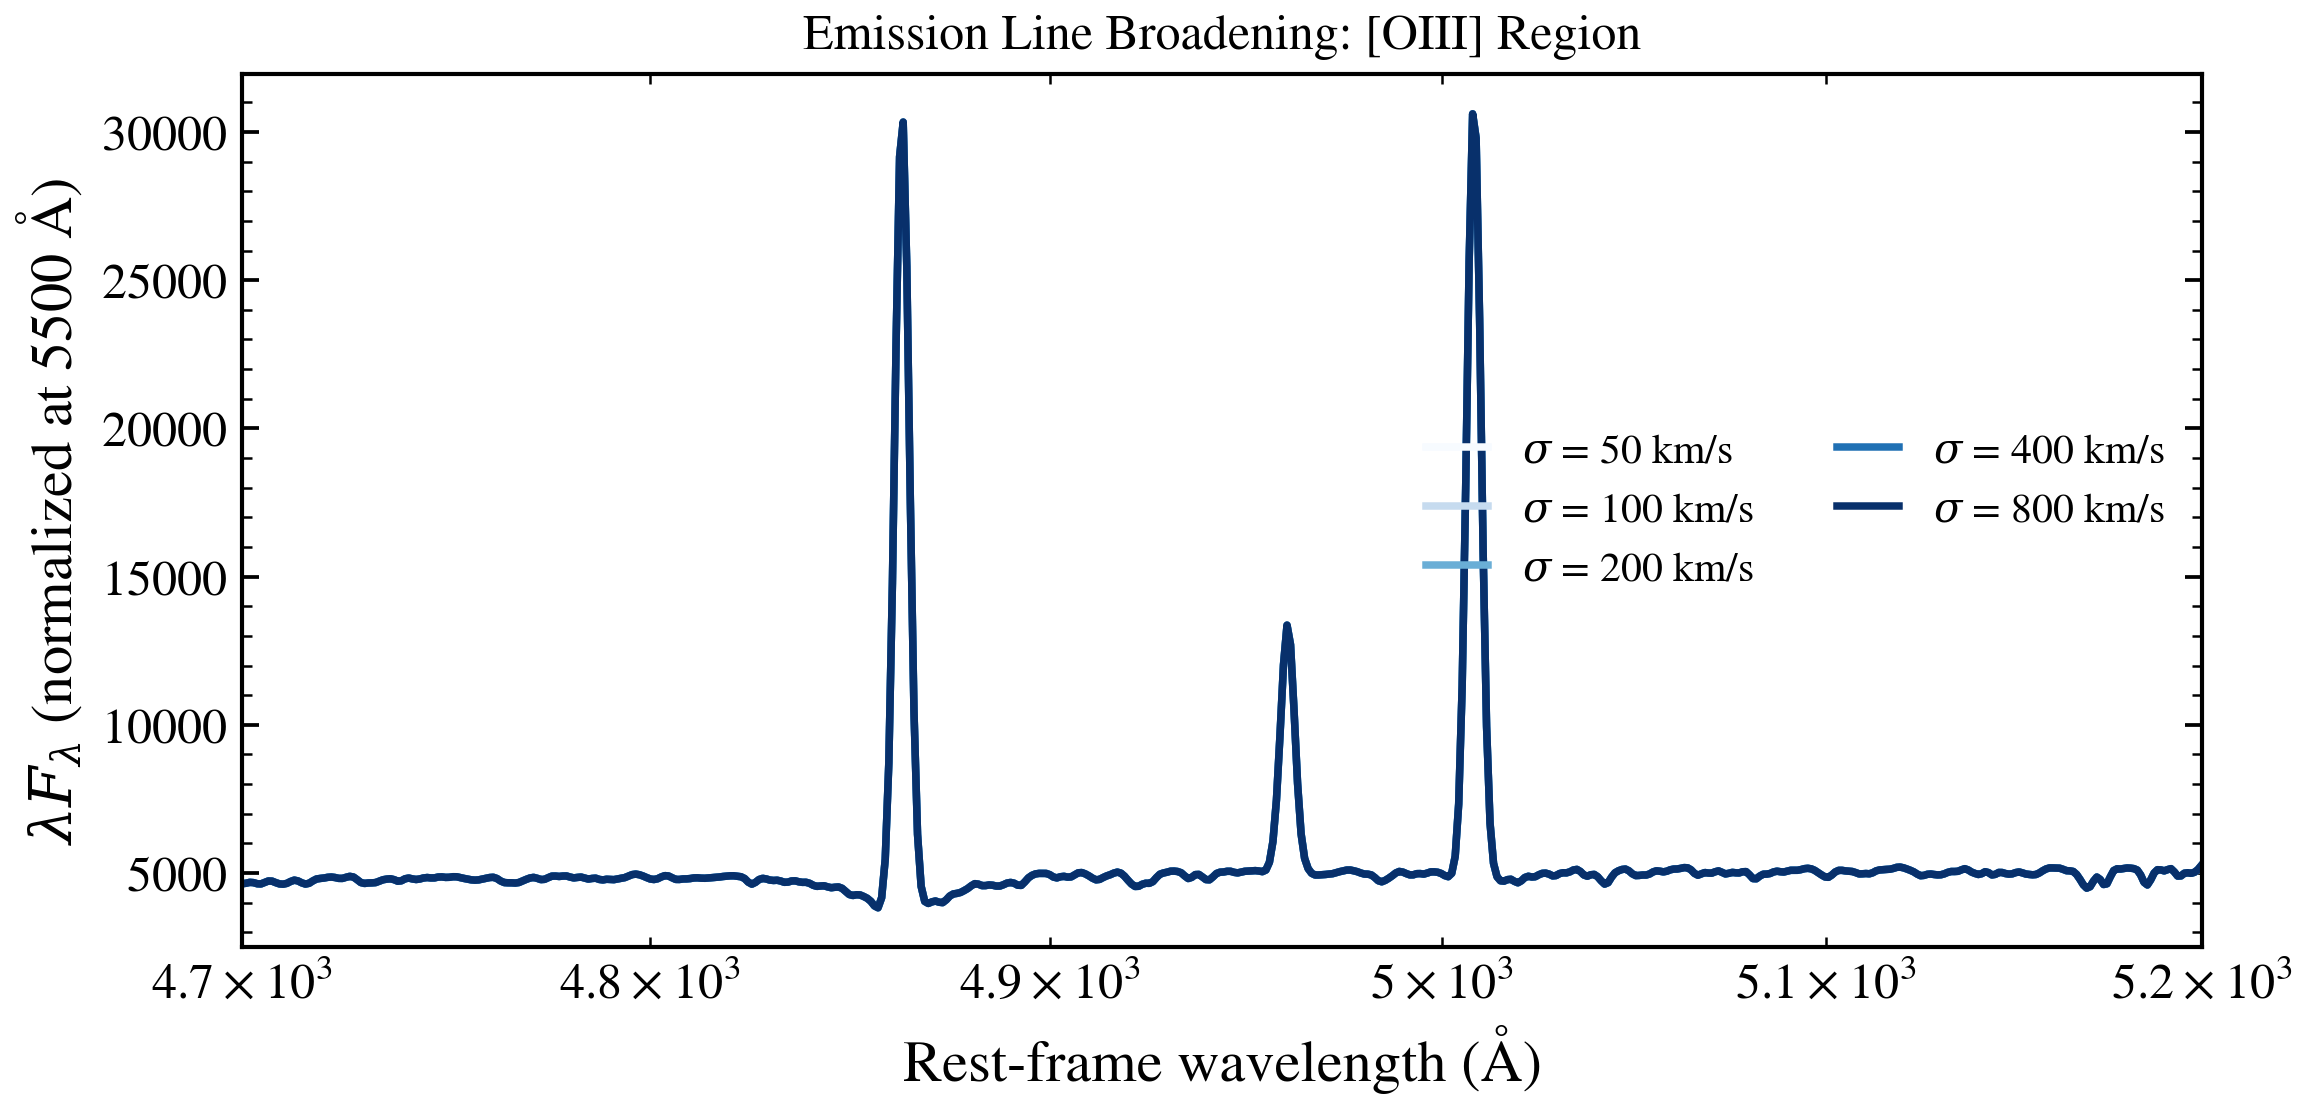
Emission Line Width (σ in km/s)
Emission line velocity dispersion broadens lines from a few km/s (narrow, kinematically resolved) to hundreds of km/s (unresolved at typical spectroscopic resolution). Line broadening is crucial for fitting restframe UV emission lines and measuring dynamics in high-redshift galaxies.
from pathlib import Path

import jax
import matplotlib.pyplot as plt

jax.config.update("jax_enable_x64", True)

from tengri import Fixed, Parameters, SEDModel, load_ssp_data
from tengri.analysis.plotting import setup_style, sweep_parameter

setup_style()


def _find_ssp():
    """Find SSP data file in standard locations."""
    name = "ssp_prsc_miles_chabrier_wNE_logGasU-3.0_logGasZ0.0.h5"
    for p in [
        Path("data") / name,
        Path("../data") / name,
        Path("../../data") / name,
        Path("../../../data") / name,
    ]:
        if p.exists():
            return str(p)
    return None


SSP_PATH = _find_ssp()
if SSP_PATH is None:
    raise FileNotFoundError("SSP data not found — skipping example")

ssp = load_ssp_data(SSP_PATH)

# --- Build model: young star-forming galaxy ---
spec = Parameters(
    nebular_cue=True,
    eline_mode="fitted",  # Enable emission line velocity dispersion fitting
    sfh_tsnorm_log_peak_sfr=Fixed(1.0),
    sfh_tsnorm_peak_lbt_gyr=Fixed(0.5),  # Peak ~500 Myr ago (young)
    sfh_tsnorm_width_gyr=Fixed(0.3),
    sfh_tsnorm_skew=Fixed(0.2),
    sfh_tsnorm_trunc=Fixed(3.0),
    met_logzsol=Fixed(-0.3),  # Solar-ish
    dust_tau_bc=Fixed(0.0),  # No dust
    dust_tau_diff=Fixed(0.0),
    dust_slope=Fixed(-0.7),
    redshift=Fixed(0.1),
    neb_logU=Fixed(-3.0),  # Fixed ionization
    neb_logZ_gas=Fixed(-0.3),
    eline_sigma_kms=Fixed(0.0),  # Will sweep this
)
model = SEDModel(spec, ssp)

# --- Sweep line width ---
values = [50, 100, 200, 400, 800]

# # The sweep_parameter helper creates a single SEDModel instance and calls
# # model.predict_rest_sed(...) in a loop. JAX JIT compilation is cached
# # automatically via tengri's persistent compilation cache (enabled at
# # import time), so repeated forward model calls reuse the compiled kernel.
fig, ax = sweep_parameter(
    model,
    "eline_sigma_kms",
    values,
    cmap="Blues",
    label_fmt=r"$\sigma$ = {:.0f} km/s",
    wave_range=(4700, 5200),
)
ax.set_title("Emission Line Broadening: [OIII] Region", fontsize=12)
ax.set_ylabel(r"$\lambda F_\lambda$ (normalized at 5500 Å)")
plt.tight_layout()
plt.savefig("plot_line_sigma_sweep.png", dpi=150, bbox_inches="tight")
plt.show()