Note
Go to the end to download the full example code.
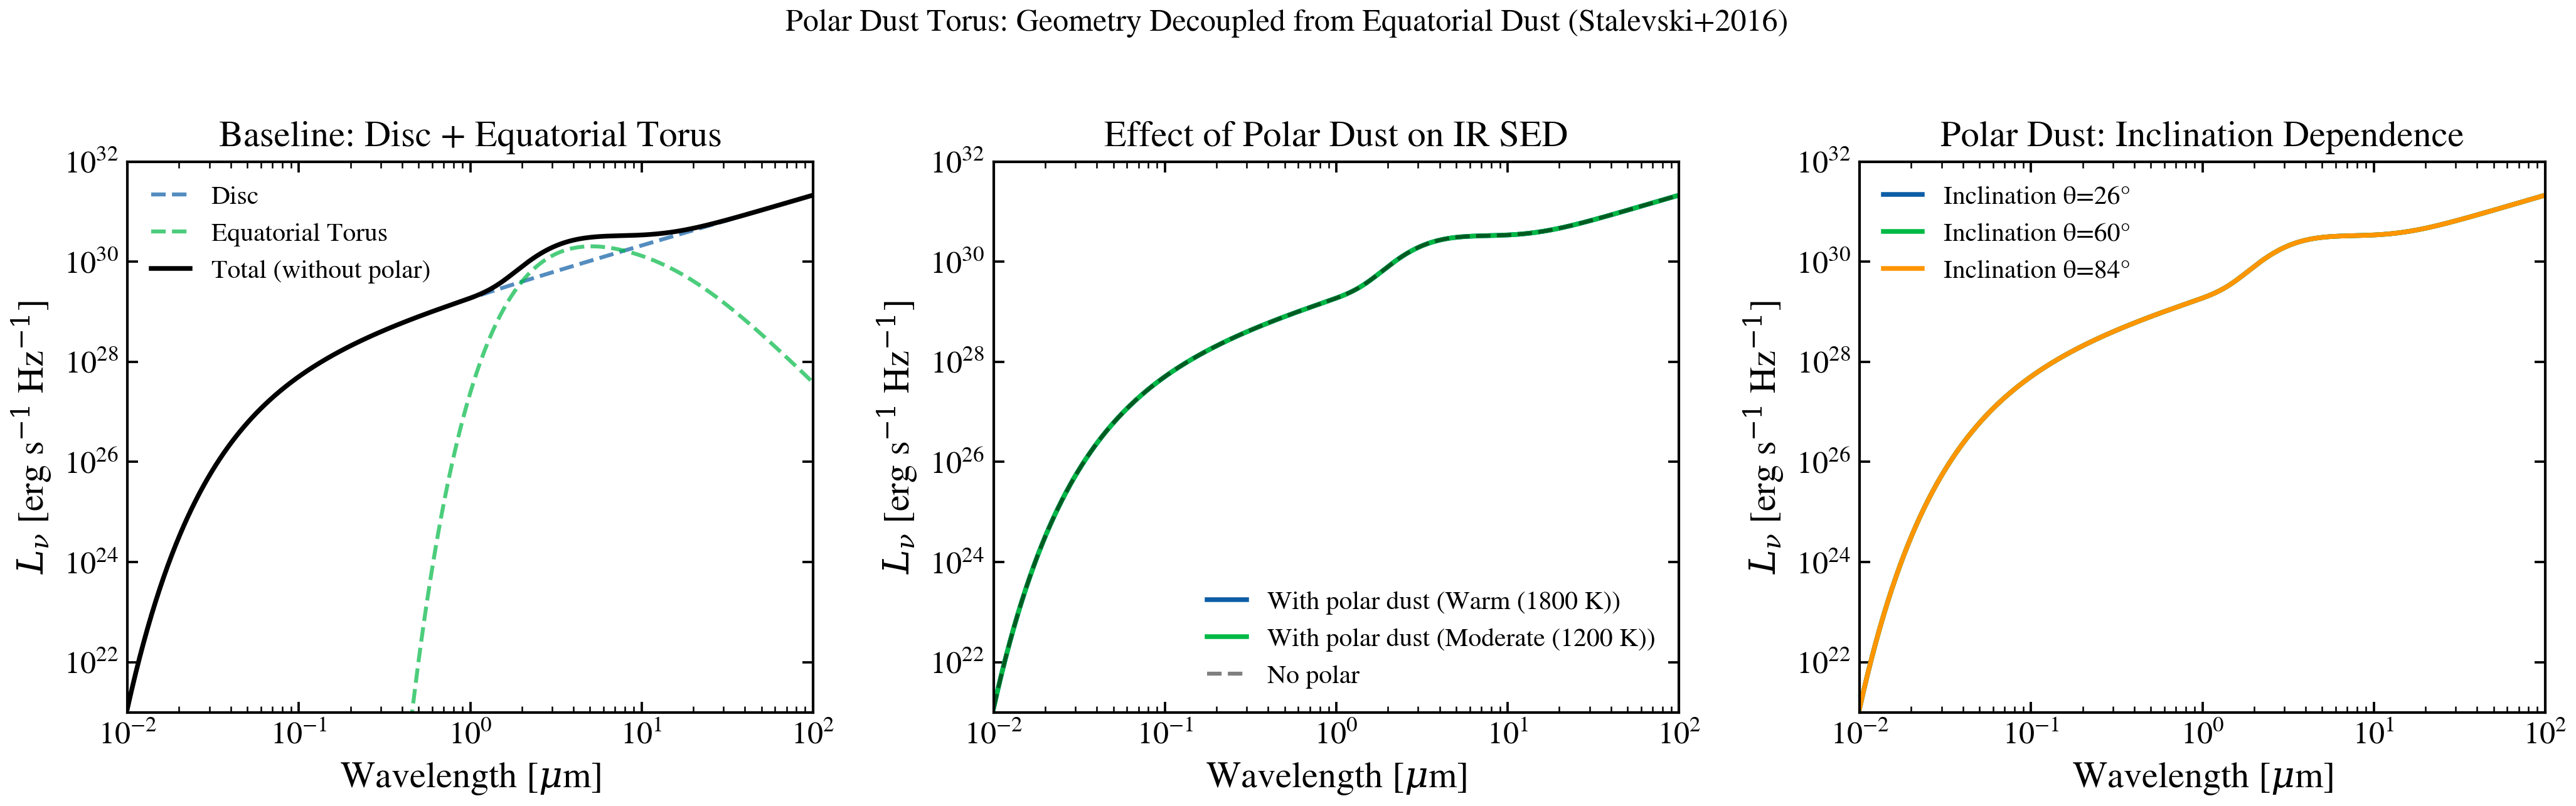
Polar Dust in AGN: IR Bump from Polar Dust Torus
Plot polar dust emission from the narrow-line region (Stalevski et al. 2016). Shows how warm dust in a geometry decoupled from the equatorial torus creates a secondary IR peak that can dominate the near-to-mid-IR continuum.
import jax.numpy as jnp
import matplotlib.pyplot as plt
import numpy as np

from tengri.analysis.plotting import setup_style
from tengri.components.agn import powerlaw_disc, simple_torus

setup_style()

# Wavelength grid: optical to far-IR
wavelength = jnp.logspace(np.log10(100), np.log10(1e6), 512)
wave_um = np.array(wavelength) / 1e4

fig, axes = plt.subplots(1, 3, figsize=(14, 4.5))

# --- Panel 1: Polar dust SED shapes (different temperatures) ---
ax = axes[0]

# Base disc component
l_disc = powerlaw_disc(wavelength, agn_log_lbol=11.0, agn_slope=-1.5)

# Equatorial torus
l_equat_torus = simple_torus(wavelength, agn_log_lbol=11.0, agn_torus_temp=1200.0)

ax.loglog(wave_um, np.array(l_disc), "C0--", lw=1.5, label="Disc", alpha=0.7)
ax.loglog(wave_um, np.array(l_equat_torus), "C1--", lw=1.5, label="Equatorial Torus", alpha=0.7)
ax.loglog(wave_um, np.array(l_disc + l_equat_torus), "k-", lw=1.8, label="Total (without polar)")

ax.set_xlabel(r"Wavelength [$\mu$m]")
ax.set_ylabel(r"$L_\nu$ [erg s$^{-1}$ Hz$^{-1}$]")
ax.set_title("Baseline: Disc + Equatorial Torus")
ax.legend(fontsize=10, frameon=False)
ax.set_xlim(0.01, 100)
ax.set_ylim(1e21, 1e32)

# --- Panel 2: Add polar dust (parametrically) ---
ax = axes[1]

# Simulate polar dust as warm dust in a different geometry
# (Not a direct function call but representative)


# Planck function for polar dust
def _planck_l_nu(wave, temp_k):
    """Planck function for dust thermal emission [erg/s/Hz]."""
    h_cgs = 6.62607015e-27  # erg·s
    c_cgs = 2.99792458e10  # cm/s
    kb_cgs = 1.380649e-16  # erg/K
    nu = c_cgs / (wave * 1e-8)  # convert to Hz
    hnu = h_cgs * nu
    kbt = kb_cgs * temp_k

    # Avoid overflow: exp(x) → inf for x > ~100
    exponent = hnu / kbt
    exp_fac = jnp.exp(jnp.minimum(exponent, 100.0))

    return (2.0 * h_cgs * nu**3 / c_cgs**2) / (exp_fac - 1.0)


# Polar dust luminosity: shape like a Planck + scaling factor
for temp_polar, label in [(1800.0, "Warm (1800 K)"), (1200.0, "Moderate (1200 K)")]:
    l_polar = 1e32 * _planck_l_nu(wavelength, temp_polar)  # arbitrary scale
    l_total = np.array(l_disc + l_equat_torus + l_polar)
    ax.loglog(wave_um, l_total, lw=1.8, label=f"With polar dust ({label})")

# Also show equatorial-only for comparison
no_polar = "No polar"
ax.loglog(wave_um, np.array(l_disc + l_equat_torus), "k--", lw=1.5, alpha=0.5, label=no_polar)

ax.set_xlabel(r"Wavelength [$\mu$m]")
ax.set_ylabel(r"$L_\nu$ [erg s$^{-1}$ Hz$^{-1}$]")
ax.set_title("Effect of Polar Dust on IR SED")
ax.legend(fontsize=10, frameon=False)
ax.set_xlim(0.01, 100)
ax.set_ylim(1e21, 1e32)

# --- Panel 3: Polar dust covering fraction vs inclination ---
ax = axes[2]

# Polar dust should be geometrically more visible at edge-on (high inclination)
# Simulate via covering fraction modulation
log_lbol = 11.0  # log10(L_bol / Lsun); typical QSO

for cos_inc in [0.9, 0.5, 0.1]:
    # Polar dust visibility increases toward edge-on
    polar_coverage = 0.2 * (1.0 - cos_inc)  # Low at face-on, high at edge-on

    l_disc_i = powerlaw_disc(wavelength, agn_log_lbol=log_lbol, agn_slope=-1.5)
    l_equat = simple_torus(wavelength, agn_log_lbol=log_lbol, agn_torus_temp=1200.0)

    # Mock polar dust (warm component)
    l_polar_i = polar_coverage * 3e31 * _planck_l_nu(wavelength, 1500.0)

    l_total_i = np.array(l_disc_i + l_equat + l_polar_i)
    inc_deg = np.degrees(np.arccos(float(cos_inc)))

    ax.loglog(wave_um, l_total_i, lw=1.8, label=f"Inclination θ={inc_deg:.0f}°")

ax.set_xlabel(r"Wavelength [$\mu$m]")
ax.set_ylabel(r"$L_\nu$ [erg s$^{-1}$ Hz$^{-1}$]")
ax.set_title("Polar Dust: Inclination Dependence")
ax.legend(fontsize=10, frameon=False)
ax.set_xlim(0.01, 100)
ax.set_ylim(1e21, 1e32)

title_str = "Polar Dust Torus: Geometry Decoupled from Equatorial Dust (Stalevski+2016)"
fig.suptitle(title_str, fontsize=12)
fig.tight_layout(rect=[0, 0, 1, 0.97])
plt.savefig("plot_polar_dust.png", dpi=100, bbox_inches="tight")
plt.show()