Note
Go to the end to download the full example code.
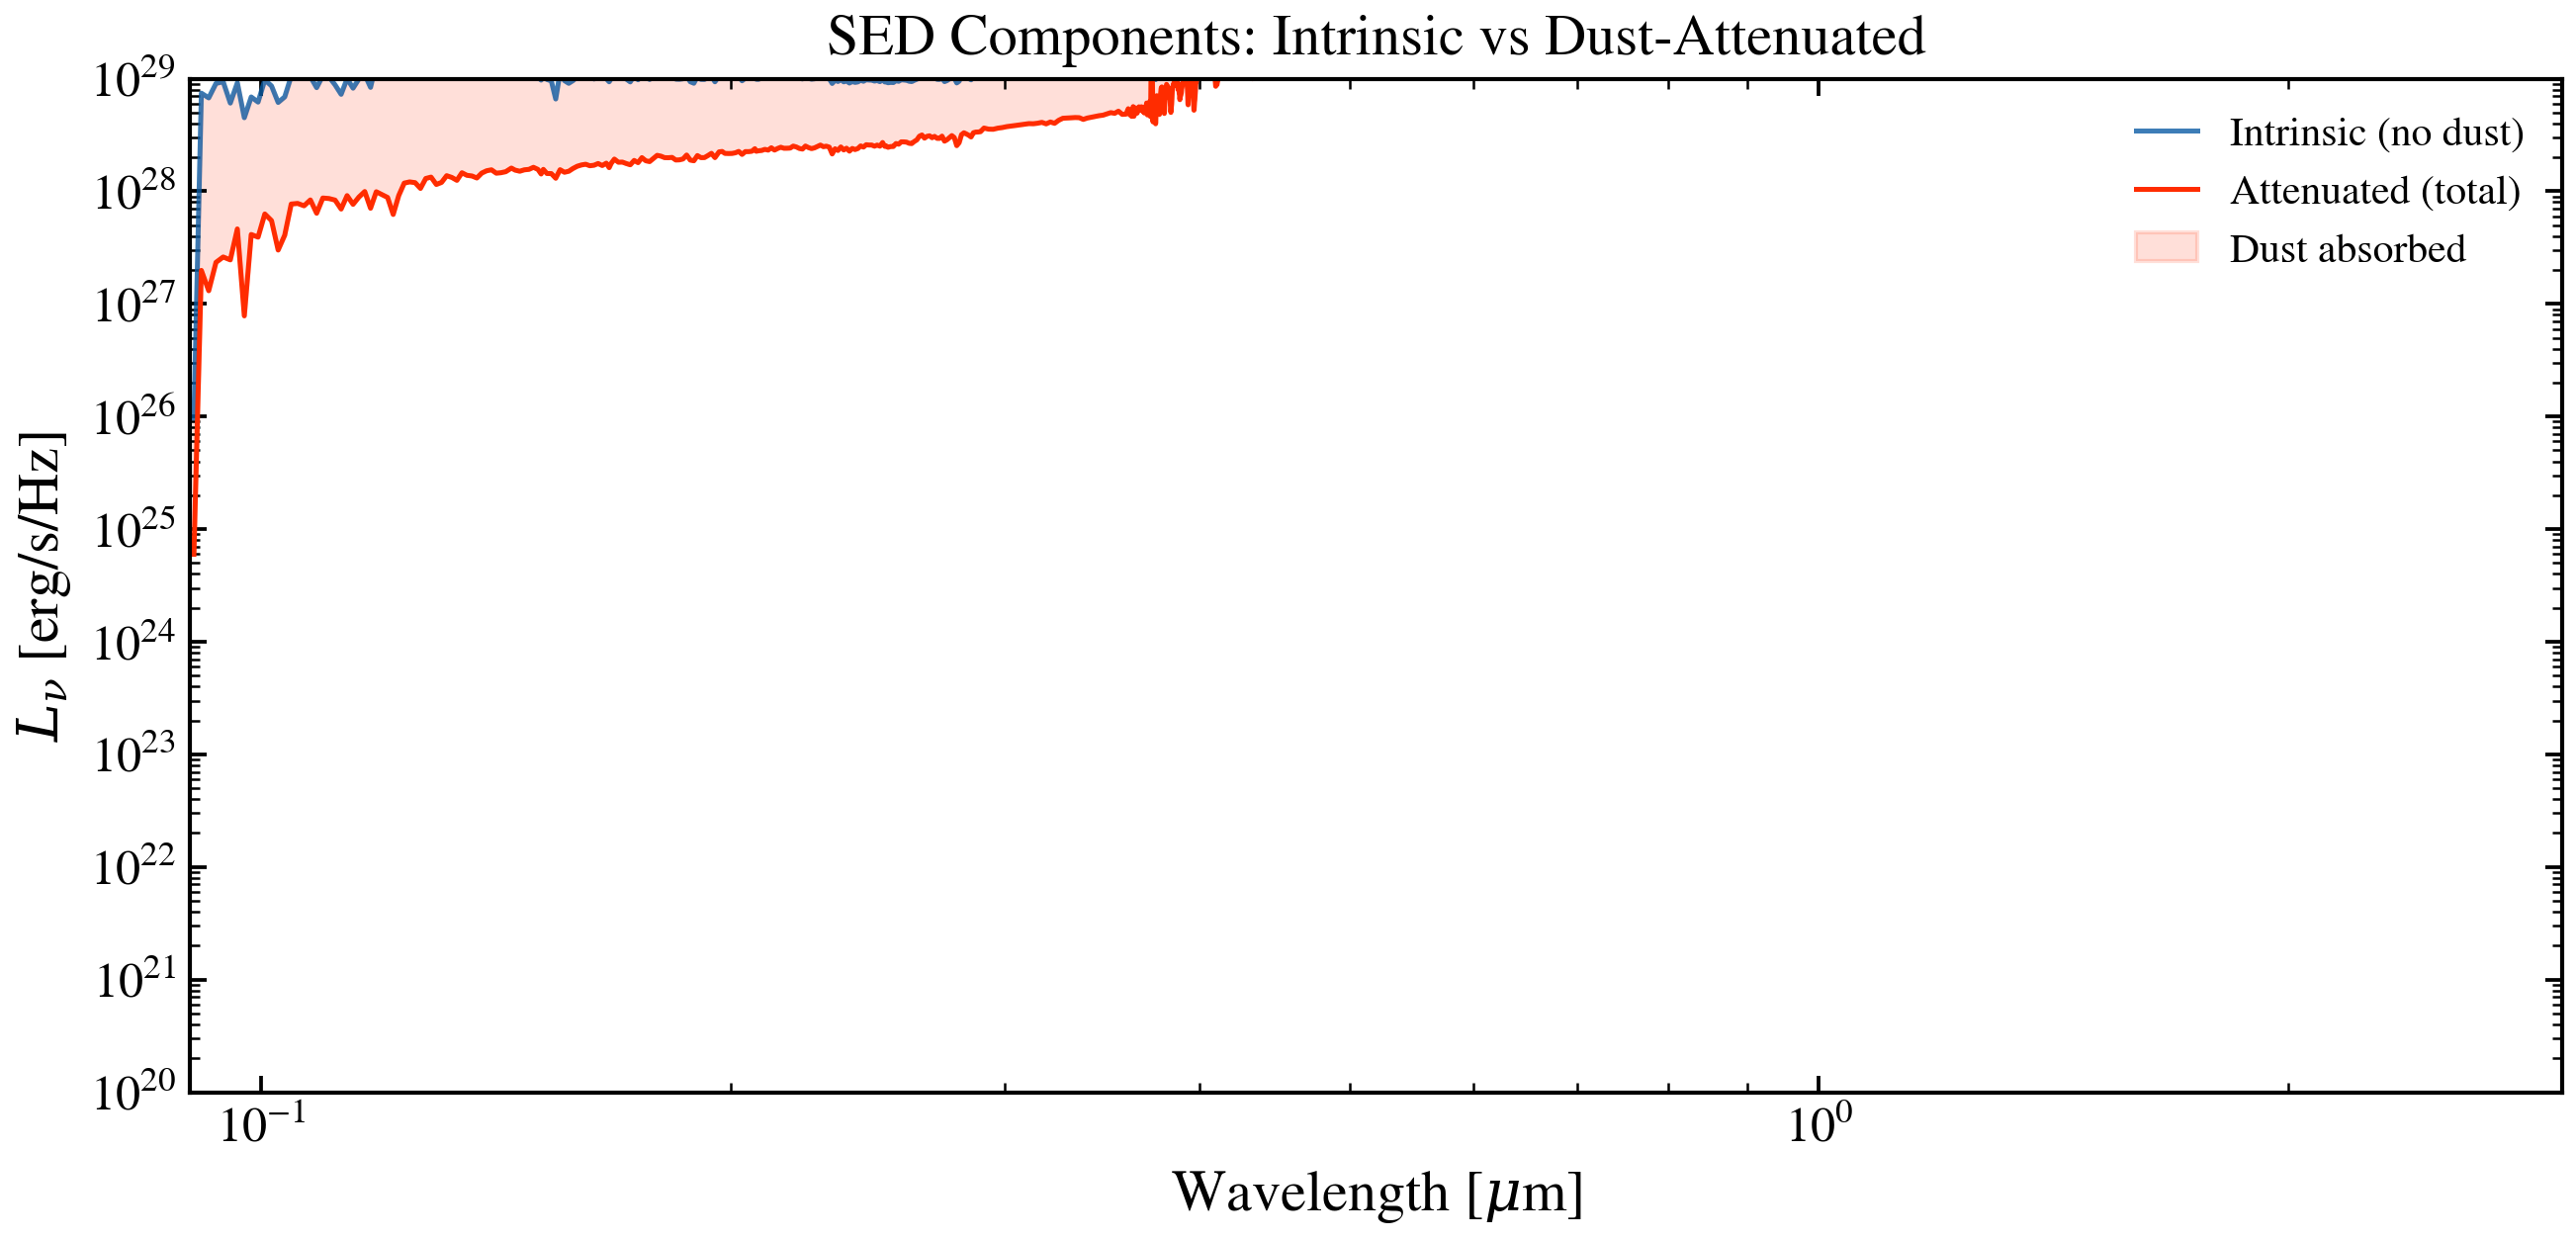
SED Components
Predict a galaxy SED and visualize its components: the intrinsic
stellar emission and the dust-attenuated total. Uses the lazy
model.predict() API and direct SED computation to show the
effect of dust attenuation on the spectrum.
from pathlib import Path

import jax
import jax.numpy as jnp
import matplotlib.pyplot as plt
import numpy as np

from tengri import (
    Fixed,
    Observation,
    Parameters,
    Photometry,
    SEDModel,
    load_ssp_data,
)
from tengri.analysis.plotting import setup_style

setup_style()


# --- Load SSP data ---
def _find_ssp():
    """Locate SSP data from project root or docs/ (sphinx-gallery) cwd."""
    name = "ssp_prsc_miles_chabrier_wNE_logGasU-3.0_logGasZ0.0.h5"
    for p in [
        Path("data") / name,
        Path("../data") / name,
        Path("../../data") / name,
        Path("../../../data") / name,
    ]:
        if p.exists():
            return str(p)
    return None


SSP_PATH = _find_ssp()

# Locate filter cache
_FILTER_DIR = next(
    (
        str(d)
        for d in [
            Path("data/filters"),
            Path("../data/filters"),
            Path("../../data/filters"),
            Path("../../../data/filters"),
        ]
        if d.exists()
    ),
    "data/filters",
)
if SSP_PATH is None:
    raise FileNotFoundError("SSP data not found — skipping example")

ssp = load_ssp_data(SSP_PATH)

# --- Define a dusty galaxy model ---
spec = Parameters(
    sfh_tsnorm_log_peak_sfr=Fixed(1.2),
    sfh_tsnorm_peak_lbt_gyr=Fixed(5.0),
    sfh_tsnorm_width_gyr=Fixed(2.0),
    sfh_tsnorm_skew=Fixed(0.5),
    sfh_tsnorm_trunc=Fixed(3.0),
    met_logzsol=Fixed(-0.3),
    dust_tau_bc=Fixed(1.0),
    dust_tau_diff=Fixed(0.5),
    dust_slope=Fixed(-0.7),
    redshift=Fixed(0.0),
    mean_sfh_type="tsnorm",
)

obs = Observation(photometry=Photometry.from_names(["sdss_r"], cache_dir=_FILTER_DIR))
model = SEDModel(spec, ssp, observation=obs)
params = spec.sample(jax.random.PRNGKey(0))

# --- Compute SEDs: with and without dust ---
sed_total = model.predict_rest_sed(params).sed

# Remove dust to get intrinsic SED
params_nodust = {k: v for k, v in params.items()}
params_nodust["dust_tau_bc"] = jnp.array(0.0)
params_nodust["dust_tau_diff"] = jnp.array(0.0)
sed_intrinsic = model.predict_rest_sed(params_nodust).sed

wave = np.array(ssp.ssp_wave)
sed_total_np = np.array(sed_total)
sed_intr_np = np.array(sed_intrinsic)

# --- Plot ---
fig, ax = plt.subplots(figsize=(9, 4.5))
mask = (wave > 900) & (wave < 30000)

ax.plot(
    wave[mask] / 1e4, sed_intr_np[mask], color="C0", lw=1.2, alpha=0.8, label="Intrinsic (no dust)"
)
ax.plot(wave[mask] / 1e4, sed_total_np[mask], color="C3", lw=1.2, label="Attenuated (total)")
ax.fill_between(
    wave[mask] / 1e4,
    sed_total_np[mask],
    sed_intr_np[mask],
    alpha=0.15,
    color="C3",
    label="Dust absorbed",
)

ax.set_xlabel(r"Wavelength [$\mu$m]")
ax.set_ylabel(r"$L_\nu$ [erg/s/Hz]")
ax.set_title("SED Components: Intrinsic vs Dust-Attenuated")
ax.set_xscale("log")
ax.set_yscale("log")
ax.set_xlim(0.09, 3.0)
ax.set_ylim(1e20, 1e29)
ax.legend(fontsize=10, frameon=False, loc="upper right")
fig.tight_layout()
plt.savefig("plot_sed_components.png", dpi=150, bbox_inches="tight")
plt.show()