Note
Go to the end to download the full example code.
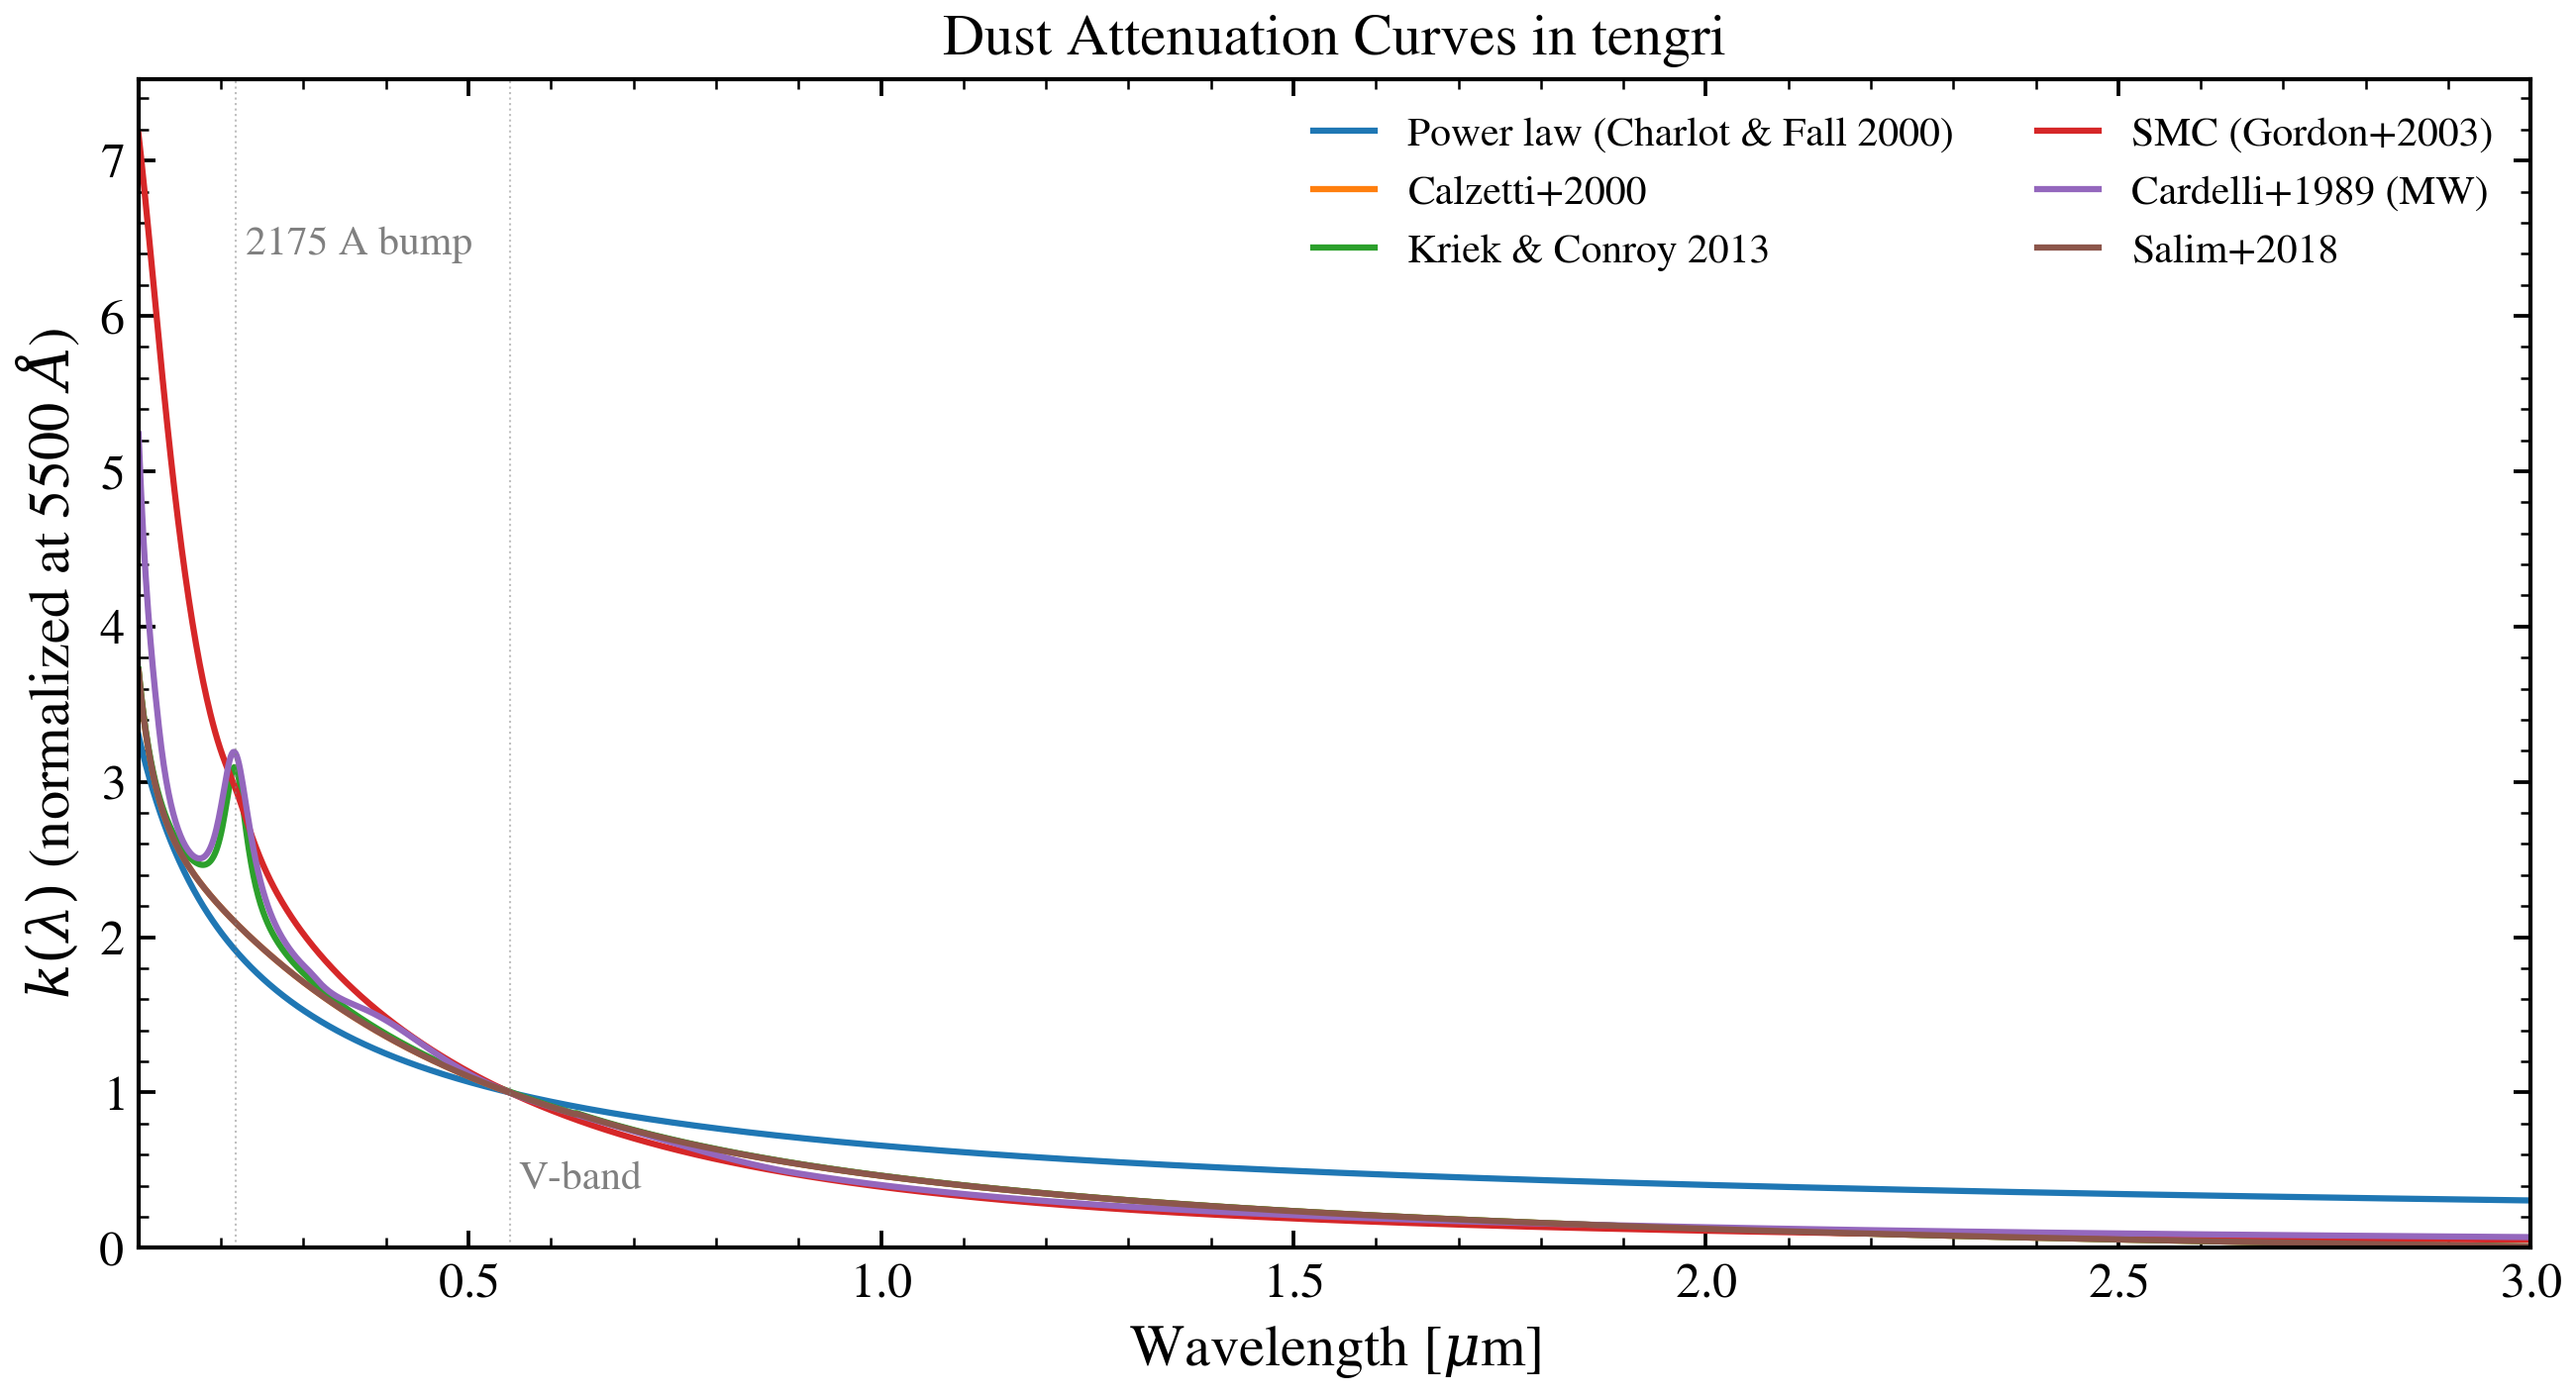
Dust Attenuation Curves
Plot all available attenuation laws in tengri. Each curve k(lambda) describes the wavelength dependence of dust attenuation, normalized at 5500 A. No SSP data required.
import jax.numpy as jnp
import matplotlib.pyplot as plt
import numpy as np

from tengri.analysis.plotting import setup_style
from tengri.dust import resolve_dust_law

setup_style()

wavelength = jnp.linspace(1000.0, 30000.0, 2000)
wave_um = np.array(wavelength) / 1e4

# --- All available attenuation curves ---
curves = [
    ("power_law", {}, "Power law (Charlot & Fall 2000)"),
    ("calzetti", {}, "Calzetti+2000"),
    ("kriek_conroy", {"dust_bump_strength": 1.0, "dust_delta": 0.0}, "Kriek & Conroy 2013"),
    ("smc", {}, "SMC (Gordon+2003)"),
    ("cardelli", {"dust_Rv": 3.1}, "Cardelli+1989 (MW)"),
    ("salim", {}, "Salim+2018"),
]

colors = ["#1f77b4", "#ff7f0e", "#2ca02c", "#d62728", "#9467bd", "#8c564b"]

# --- Plot ---
fig, ax = plt.subplots(figsize=(9, 5))
for (name, kwargs, label), color in zip(curves, colors):
    dust_fn = resolve_dust_law(name)
    k = dust_fn(wavelength, **kwargs)
    ax.plot(wave_um, np.array(k), label=label, color=color, lw=1.5)

ax.axvline(0.55, ls=":", color="grey", lw=0.5, alpha=0.5)
ax.annotate(
    "V-band", xy=(0.56, 0.05), xycoords=("data", "axes fraction"), fontsize=10, color="grey"
)
ax.axvline(0.2175, ls=":", color="grey", lw=0.5, alpha=0.5)
ax.annotate(
    "2175 A bump", xy=(0.23, 0.85), xycoords=("data", "axes fraction"), fontsize=10, color="grey"
)

ax.set_xlabel(r"Wavelength [$\mu$m]")
ax.set_ylabel(r"$k(\lambda)$ (normalized at 5500 $\AA$)")
ax.set_title("Dust Attenuation Curves in tengri")
ax.set_xlim(0.1, 3.0)
ax.set_ylim(0, None)
ax.legend(fontsize=10, frameon=False, ncol=2)
fig.tight_layout()
plt.savefig("plot_dust_curves.png", dpi=150, bbox_inches="tight")
plt.show()