Note
Go to the end to download the full example code.
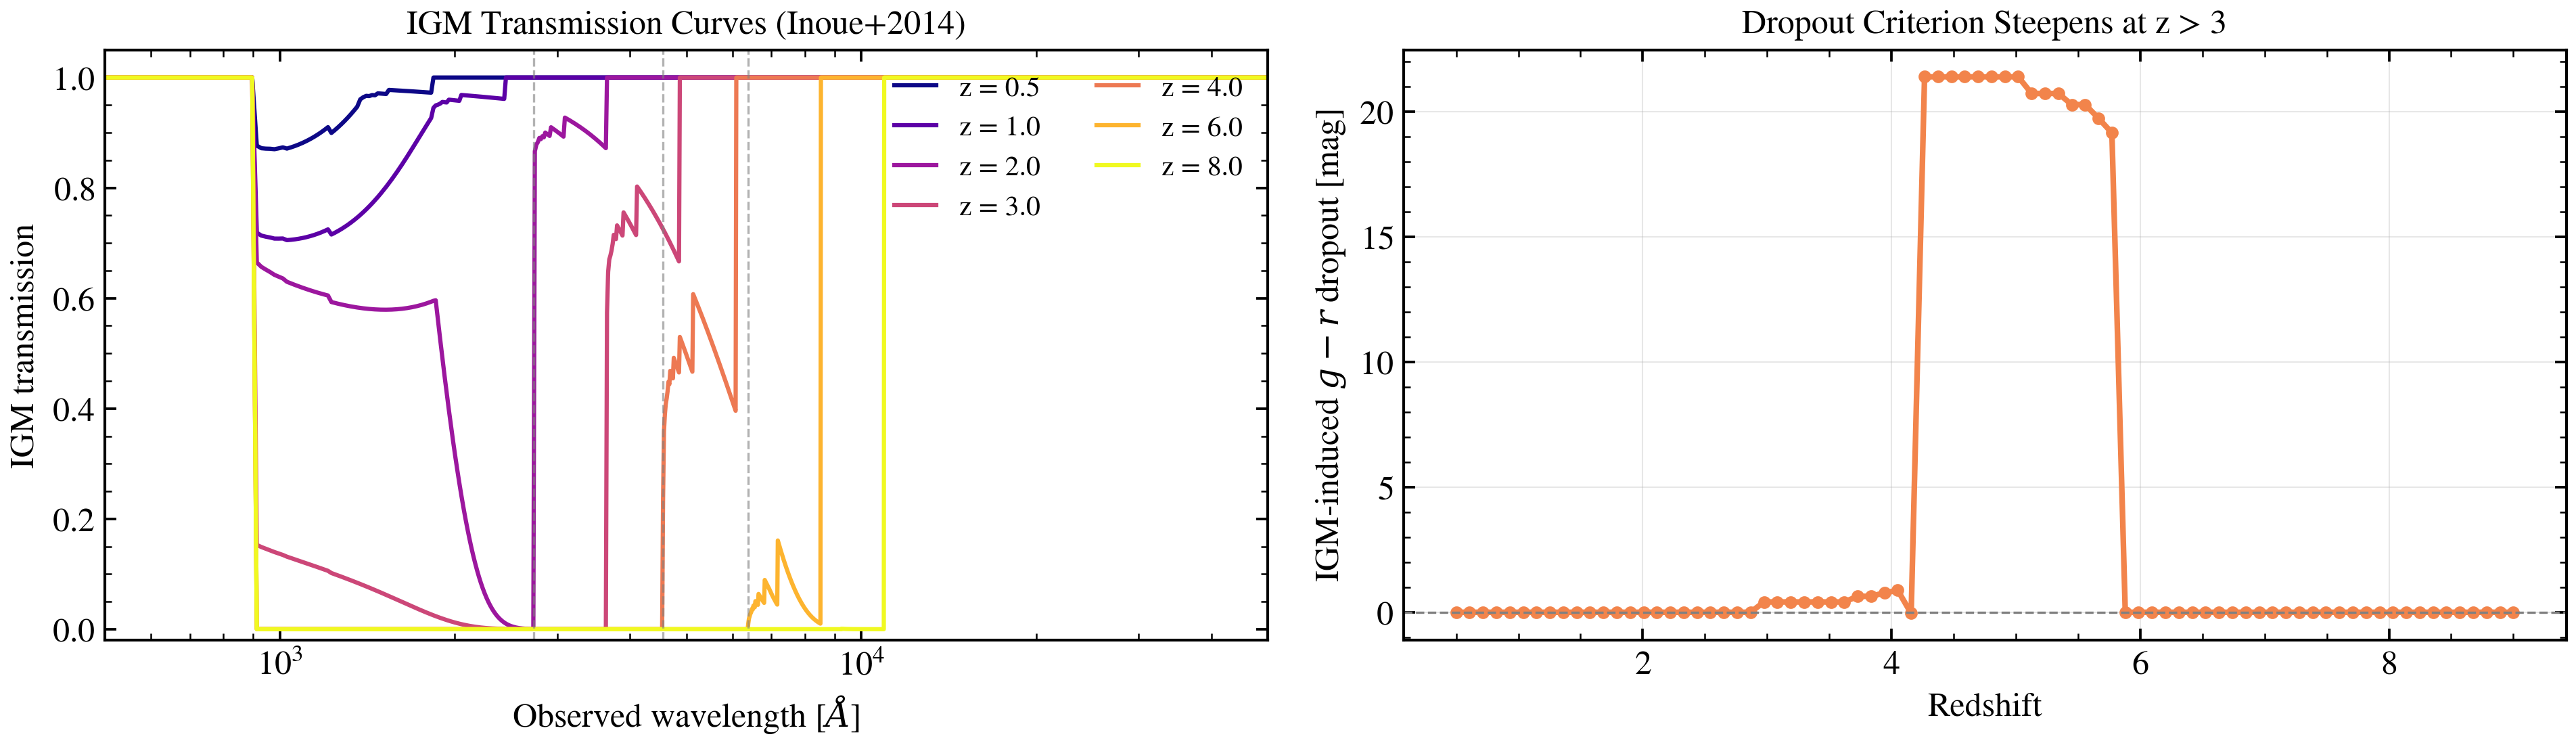
IGM Transmission vs Redshift
The intergalactic medium (IGM) imprints wavelength-dependent opacity on observed galaxy SEDs via Lyman-series and Lyman-continuum absorption (Inoue et al. 2014). At \(z > 2\) the Lyman break at 912 Å rest-frame shifts into the optical, enabling photometric redshift estimation via the “dropout” technique.
igm_transmission(wave_obs, z) takes observed-frame wavelengths.
import jax
import jax.numpy as jnp
import matplotlib.pyplot as plt
import numpy as np

jax.config.update("jax_enable_x64", True)

from tengri.analysis.plotting import SWEEP_CMAPS, setup_style
from tengri.igm import igm_transmission

setup_style()

# Observed-frame wavelength grid covering UV to NIR
wave_obs = jnp.linspace(500.0, 50000.0, 3000)

redshifts = [0.5, 1.0, 2.0, 3.0, 4.0, 6.0, 8.0]
cmap = plt.get_cmap(SWEEP_CMAPS["redshift"])
colors = [cmap(i / max(len(redshifts) - 1, 1)) for i in range(len(redshifts))]

fig, axes = plt.subplots(1, 2, figsize=(13, 4))

# --- Left: transmission curves ---
ax = axes[0]
for z, color in zip(redshifts, colors):
    trans = igm_transmission(wave_obs, z)
    ax.plot(np.array(wave_obs), np.array(trans), color=color, lw=1.5, label=f"z = {z}")

# Mark Lyman break at 912 Å rest-frame for a few redshifts
for z in [2.0, 4.0, 6.0]:
    ax.axvline(912.0 * (1 + z), color="0.5", lw=0.8, ls="--", alpha=0.6)

ax.set_xlabel(r"Observed wavelength [$\AA$]", fontsize=12)
ax.set_ylabel("IGM transmission", fontsize=12)
ax.set_xlim(500, 50000)
ax.set_xscale("log")
ax.set_ylim(-0.02, 1.05)
ax.legend(fontsize=10, frameon=False, ncol=2, loc="upper right")
ax.set_title("IGM Transmission Curves (Inoue+2014)", fontsize=12)

# --- Right: Lyman-break dropout colour vs redshift ---
ax = axes[1]
z_grid = np.linspace(0.5, 9.0, 80)

# u dropout: u drops out when Lyman break enters u band (~3600 Å)
# g dropout: at z~3, g band (4770 Å) is below Lyman break
# Compute synthetic g-r colour induced by IGM as a simple proxy
g_wave = 4770.0
r_wave = 6231.0
dropout_gr = []
for z in z_grid:
    tg = float(igm_transmission(jnp.array([g_wave]), z)[0])
    tr = float(igm_transmission(jnp.array([r_wave]), z)[0])
    # delta mag = -2.5 * log10(T_g / T_r), add floor to avoid log(0)
    dropout_gr.append(-2.5 * np.log10(max(tg, 1e-9) / max(tr, 1e-9)))

ax.plot(z_grid, dropout_gr, "o-", color=cmap(0.7), ms=3.5, lw=2.0)
ax.axhline(0, color="0.5", lw=0.8, ls="--")
ax.set_xlabel("Redshift", fontsize=12)
ax.set_ylabel(r"IGM-induced $g - r$ dropout [mag]", fontsize=12)
ax.set_title("Dropout Criterion Steepens at z > 3", fontsize=12)
ax.grid(True, alpha=0.3)

plt.tight_layout()
plt.savefig("plot_igm_redshift.png", dpi=150, bbox_inches="tight")
plt.show()