Note
Go to the end to download the full example code.
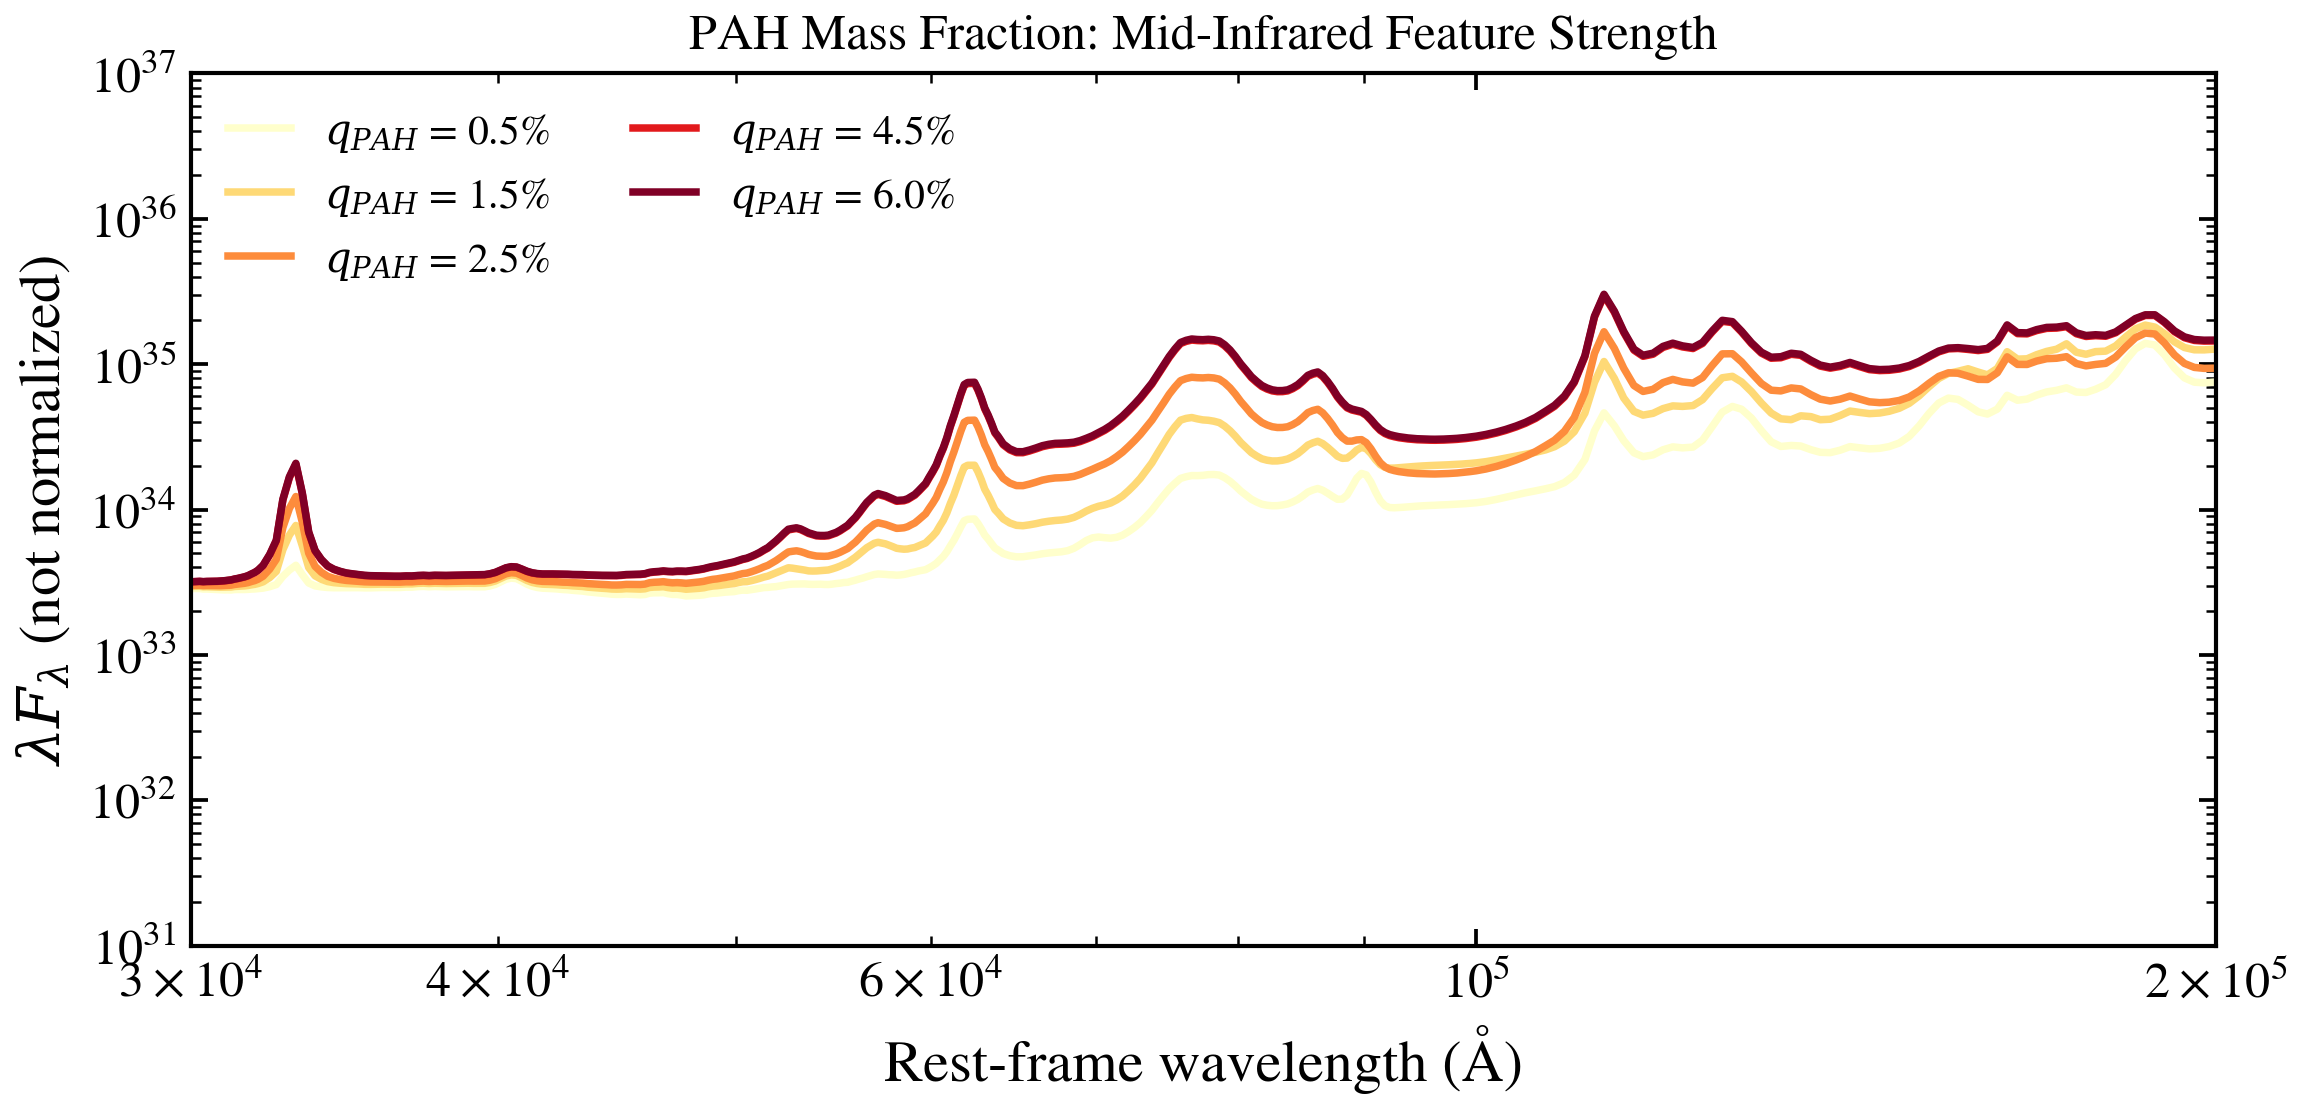
PAH Mass Fraction (q_PAH)
The PAH mass fraction q_PAH controls the strength of polycyclic aromatic hydrocarbon (PAH) mid-infrared emission features at 3.3, 6.2, 7.7, 8.6, and 11.3 μm. Higher q_PAH → stronger PAH features. Range: 0.47–4.58 % for DL07, 0.47–7.32 % for DL14.
from pathlib import Path

import jax
import matplotlib.pyplot as plt

jax.config.update("jax_enable_x64", True)

from tengri import Fixed, Parameters, SEDModel, load_ssp_data
from tengri.analysis.plotting import SWEEP_CMAPS, setup_style, sweep_parameter

setup_style()


def _find_ssp():
    """Find SSP data file in standard locations."""
    name = "ssp_prsc_miles_chabrier_wNE_logGasU-3.0_logGasZ0.0.h5"
    for p in [
        Path("data") / name,
        Path("../data") / name,
        Path("../../data") / name,
        Path("../../../data") / name,
    ]:
        if p.exists():
            return str(p)
    return None


SSP_PATH = _find_ssp()
if SSP_PATH is None:
    raise FileNotFoundError("SSP data not found — skipping example")

ssp = load_ssp_data(SSP_PATH)

# --- Build model with DL07 dust emission ---
spec = Parameters(
    dust_emission="draine_li2007",
    sfh_tsnorm_log_peak_sfr=Fixed(1.0),
    sfh_tsnorm_peak_lbt_gyr=Fixed(1.5),
    sfh_tsnorm_width_gyr=Fixed(1.0),
    sfh_tsnorm_skew=Fixed(0.2),
    sfh_tsnorm_trunc=Fixed(3.0),
    met_logzsol=Fixed(-0.3),
    dust_tau_bc=Fixed(1.0),
    dust_tau_diff=Fixed(0.5),
    dust_slope=Fixed(-0.7),
    dust_umin=Fixed(1.0),
    dust_gamma_dl=Fixed(0.01),
    dust_qpah=Fixed(2.5),  # Will sweep this
    redshift=Fixed(0.1),
)
model = SEDModel(spec, ssp)

# --- Sweep dust_qpah (%), zoomed to mid-IR where PAH features dominate ---
# Mid-IR zoom: 3–20 μm = 3e4 Å to 2e5 Å
values = [0.5, 1.5, 2.5, 4.5, 6.0]

# # The sweep_parameter helper creates a single SEDModel instance and calls
# # model.predict_rest_sed(...) in a loop. JAX JIT compilation is cached
# # automatically via tengri's persistent compilation cache (enabled at
# # import time), so repeated forward model calls reuse the compiled kernel.
fig, ax = sweep_parameter(
    model,
    "dust_qpah",
    values,
    cmap=SWEEP_CMAPS["dust"],
    label_fmt=r"$q_{{PAH}}$ = {:.1f}%",
    wave_range=(3e4, 2e5),  # 3–20 μm in Ångströms
    normalize_at=None,
)
ax.set_yscale("log")
ax.set_xscale("log")
ax.set_ylim(1e31, 1e37)
ax.set_title("PAH Mass Fraction: Mid-Infrared Feature Strength", fontsize=12)
ax.set_ylabel(r"$\lambda F_\lambda$ (not normalized)")
plt.tight_layout()
plt.savefig("plot_qpah_sweep.png", dpi=150, bbox_inches="tight")
plt.show()