Note
Go to the end to download the full example code.
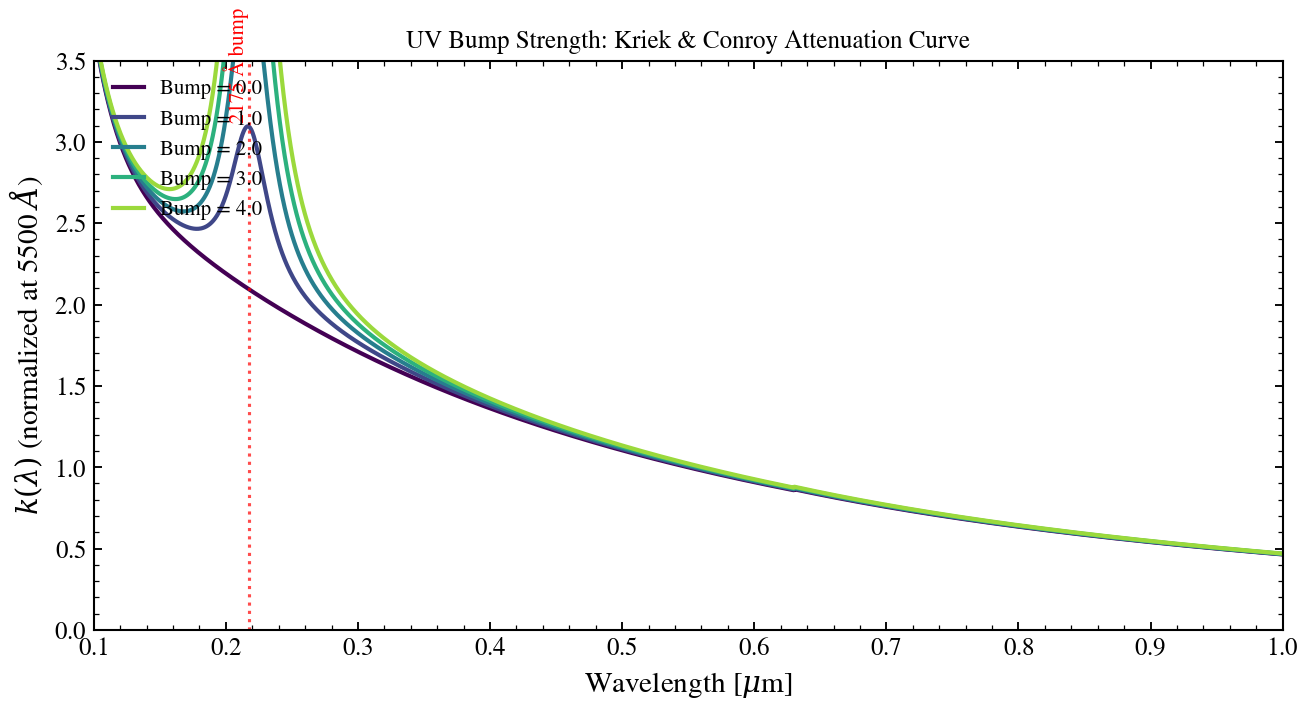
UV Bump Strength (dust_bump_strength)
The 2175 Å UV bump in dust attenuation curves is usually attributed to PAHs or small graphite grains. Sweeping the bump amplitude from zero to MW-like takes the attenuation curve from a smooth power law to the characteristic MW shape.
import jax.numpy as jnp
import matplotlib.pyplot as plt
import numpy as np

from tengri.analysis.plotting import setup_style
from tengri.dust import resolve_dust_law

setup_style()

wavelength = jnp.linspace(1000.0, 10000.0, 2000)
wave_um = np.array(wavelength) / 1e4

# --- Sweep UV-bump amplitude (dust_bump_strength) ---
values = [0.0, 1.0, 2.0, 3.0, 4.0]
colors = plt.cm.viridis(np.linspace(0.0, 0.85, len(values)))

fig, ax = plt.subplots(figsize=(9, 5))

dust_fn = resolve_dust_law("kriek_conroy")
for val, color in zip(values, colors):
    k = dust_fn(wavelength, dust_bump_strength=val, dust_delta=0.0)
    ax.plot(wave_um, np.array(k), lw=2.0, color=color, label=f"Bump = {val:.1f}")

# --- Highlight the 2175 A bump ---
ax.axvline(0.2175, ls=":", color="red", lw=1.5, alpha=0.7)
ax.annotate(
    "2175 Å bump",
    xy=(0.2175, 0.9),
    xycoords=("data", "axes fraction"),
    fontsize=10,
    color="red",
    rotation=90,
    ha="right",
)

ax.set_xlabel(r"Wavelength [$\mu$m]")
ax.set_ylabel(r"$k(\lambda)$ (normalized at 5500 $\AA$)")
ax.set_title("UV Bump Strength: Kriek & Conroy Attenuation Curve", fontsize=12)
ax.set_xlim(0.1, 1.0)
ax.set_ylim(0, 3.5)
ax.legend(fontsize=10, frameon=False, loc="upper left")
fig.tight_layout()
plt.savefig("plot_uv_bump_sweep.png", dpi=150, bbox_inches="tight")
plt.show()