Note
Go to the end to download the full example code.
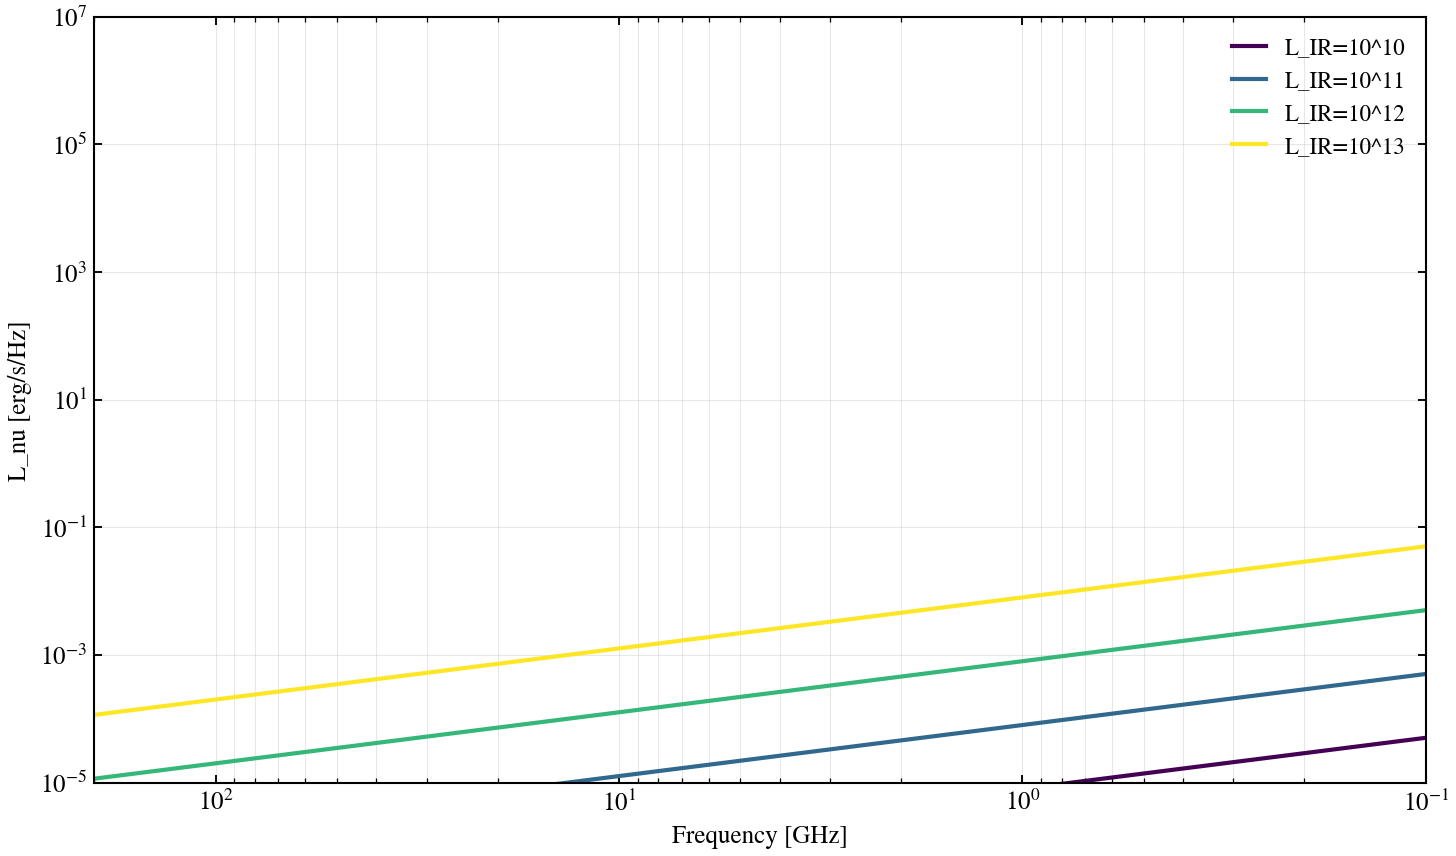
FIR-Radio Correlation: L_IR Luminosity Sweep
The FIR-radio correlation links far-infrared luminosity (reprocessed dust emission from star formation) to 1.4 GHz radio synchrotron emission. This script sweeps infrared luminosity L_IR ∈ {10, 11, 12, 13} L_sun and shows resulting synchrotron + thermal radio SEDs using the canonical q_IR = 2.64 parameter, demonstrating how more luminous starbursts produce stronger radio.
from pathlib import Path

import jax
import jax.numpy as jnp
import matplotlib

matplotlib.use("Agg")
import matplotlib.pyplot as plt
import numpy as np

jax.config.update("jax_enable_x64", True)

from tengri.analysis.plotting import SWEEP_CMAPS, setup_style
from tengri.radio import radio_star_forming

setup_style()

# --- Wavelength grid: radio regime (1 mm to 10 m) ---
wave = jnp.logspace(7, 11, 600)  # Angstrom: 1 mm = 1e7 Å, 10 m = 1e11 Å

# IR luminosity values to sweep (10^10 to 10^13 L_sun: starburst to ULIRG)
log_L_ir = [10.0, 11.0, 12.0, 13.0]
L_ir_labels = [rf"$10^{{{int(ll)}}}$" for ll in log_L_ir]
L_ir_values = [10.0**ll for ll in log_L_ir]

# Fixed q_IR = 2.64 (canonical value, Bell 2003)
q_ir = 2.64

cmap = plt.get_cmap(SWEEP_CMAPS["radio"])
colors = [cmap(i / max(len(log_L_ir) - 1, 1)) for i in range(len(log_L_ir))]

fig, ax = plt.subplots(figsize=(10, 6))

for L_ir, _log_lir, color, lbl in zip(L_ir_values, log_L_ir, colors, L_ir_labels):
    # radio_star_forming returns L_nu in erg/s/Hz at 1.4 GHz normalized L_IR
    L_nu = radio_star_forming(wave, L_ir=L_ir, q_ir=q_ir, alpha_sf=0.8)

    # Convert wavelength to frequency for cleaner radio axis
    nu_ghz = (3e18 / np.array(wave)) / 1e9  # Å → Hz → GHz

    ax.loglog(
        nu_ghz,
        np.array(L_nu),
        color=color,
        lw=2.0,
        label=rf"$L_{{\mathrm{{IR}}}} = {lbl}\,L_\odot$",
    )

ax.set_xlabel("Frequency [GHz]", fontsize=12)
ax.set_ylabel(r"$L_\nu$ [erg s$^{-1}$ Hz$^{-1}$]", fontsize=12)
ax.invert_xaxis()
ax.set_xlim(200, 0.1)
ax.set_ylim(1e-5, 1e7)
ax.legend(fontsize=11, frameon=False, loc="upper right")
ax.set_title(
    rf"FIR-Radio Correlation: Radio SED from Star Formation (q$_{{\mathrm{{IR}}}}$={q_ir})",
    fontsize=14,
)
ax.grid(True, alpha=0.3, which="both")

fig.tight_layout()
# Save to script directory
script_dir = Path(__file__).resolve().parent if "__file__" in dir() else Path(".")
plt.savefig(str(script_dir / "plot_radio_lir_relation.png"), dpi=150, bbox_inches="tight")
plt.close()