Note
Go to the end to download the full example code.
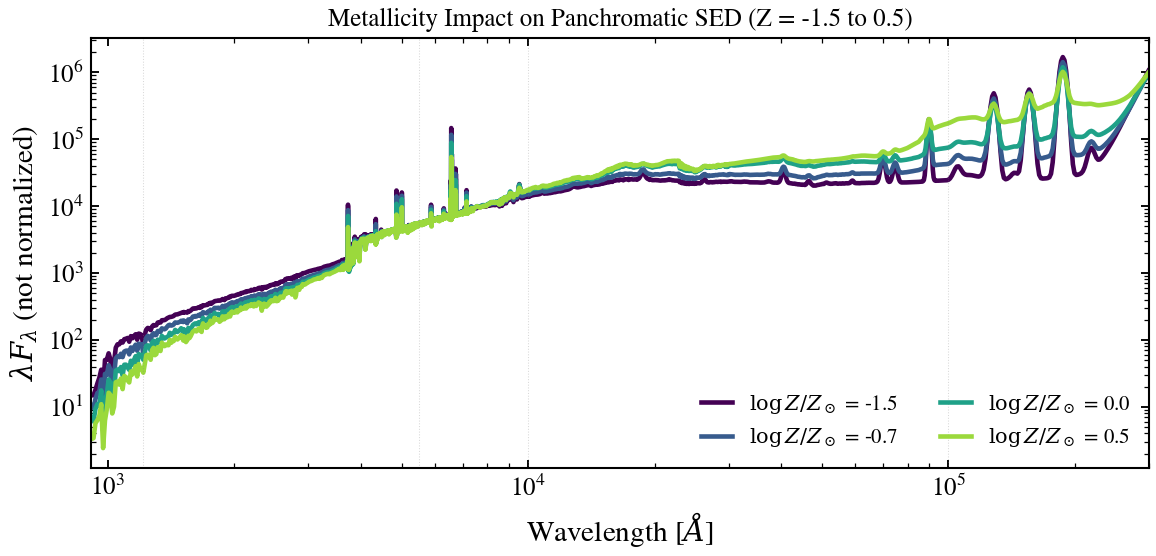
Metallicity Sweep: Panchromatic SED
Demonstrate how stellar metallicity affects the full galaxy SED from ultraviolet through mid-infrared. Metallicity impacts stellar absorption features, dust opacity, and energy balance. Sweeps log(Z/Z_sun) ∈ {-1.5, -0.7, 0.0, 0.5} on a composite SED including dust emission.
from pathlib import Path

import jax
import matplotlib.pyplot as plt

jax.config.update("jax_enable_x64", True)

from tengri import Fixed, Parameters, SEDModel, load_ssp_data
from tengri.analysis.plotting import setup_style, sweep_parameter

setup_style()


def _find_ssp():
    """Find SSP data file in standard locations."""
    name = "ssp_prsc_miles_chabrier_wNE_logGasU-3.0_logGasZ0.0.h5"
    for p in [
        Path("data") / name,
        Path("../data") / name,
        Path("../../data") / name,
        Path("../../../data") / name,
    ]:
        if p.exists():
            return str(p)
    return None


SSP_PATH = _find_ssp()
if SSP_PATH is None:
    raise FileNotFoundError("SSP data not found — skipping example")

ssp = load_ssp_data(SSP_PATH)

# --- Build model: star-forming galaxy with dust emission ---
spec = Parameters(
    dust_emission="modified_blackbody",
    sfh_tsnorm_log_peak_sfr=Fixed(1.0),
    sfh_tsnorm_peak_lbt_gyr=Fixed(1.0),
    sfh_tsnorm_width_gyr=Fixed(0.8),
    sfh_tsnorm_skew=Fixed(0.2),
    sfh_tsnorm_trunc=Fixed(3.0),
    met_logzsol=Fixed(0.0),  # Will sweep this
    dust_tau_bc=Fixed(1.0),
    dust_tau_diff=Fixed(0.5),
    dust_slope=Fixed(-0.7),
    dust_T=Fixed(30.0),
    dust_beta_ir=Fixed(1.8),
    redshift=Fixed(0.2),
)
model = SEDModel(spec, ssp)

# --- Sweep stellar metallicity: panchromatic range (UV to MIR) ---
values = [-1.5, -0.7, 0.0, 0.5]
fig, ax = sweep_parameter(
    model,
    "met_logzsol",
    values,
    cmap="viridis",
    label_fmt=r"$\log Z/Z_\odot$ = {:.1f}",
    wave_range=(912, 3e5),  # 912 Å (Lyman limit) to ~30 μm (mid-IR)
)

ax.set_xscale("log")
ax.set_yscale("log")
ax.set_title(r"Metallicity Impact on Panchromatic SED (Z = -1.5 to 0.5)", fontsize=12)
ax.set_xlabel(r"Wavelength [$\AA$]")
ax.set_ylabel(r"$\lambda F_\lambda$ (not normalized)")

# Mark key wavelengths
for wl_aa, _label in [(1215, "Ly-α"), (5500, "V-band"), (1e4, "NIR"), (1e5, "FIR")]:
    ax.axvline(wl_aa, color="grey", ls=":", lw=0.5, alpha=0.3)

plt.tight_layout()
plt.savefig("plot_logzsol_panchromatic.png", dpi=150, bbox_inches="tight")
plt.show()