Note
Go to the end to download the full example code.
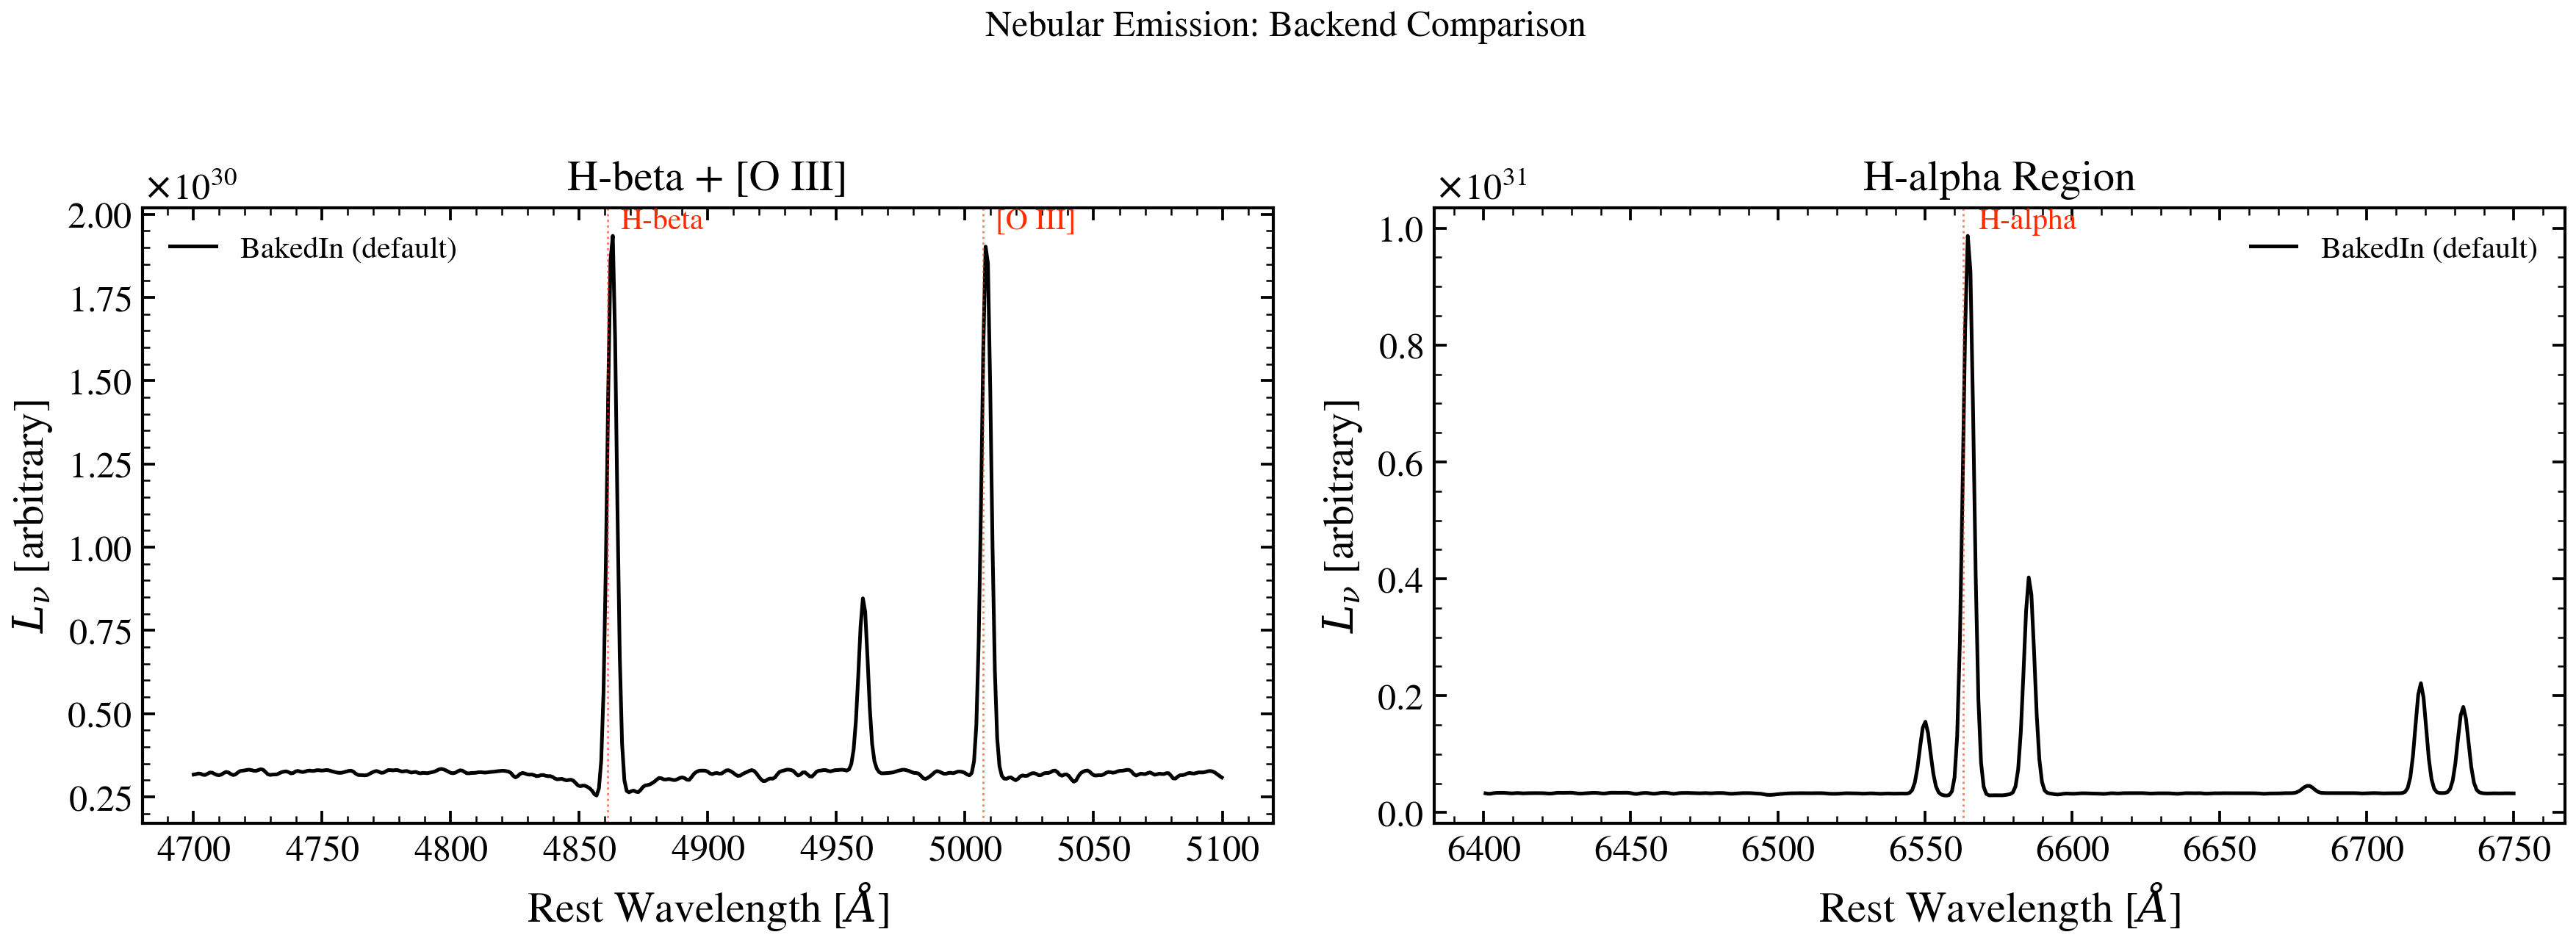
Nebular Emission Backends
Compare tengri’s three nebular emission backends: BakedIn (SSP-embedded), CloudyGrid (tabulated photoionization), and Cue (neural emulator). Shows how each backend predicts emission lines in the optical window.
from pathlib import Path

import matplotlib.pyplot as plt
import numpy as np

from tengri import Fixed, Parameters, SEDModel, load_ssp_data
from tengri.analysis.plotting import setup_style

setup_style()


# --- Check for SSP data ---
def _find_ssp():
    """Locate SSP data from project root or docs/ (sphinx-gallery) cwd."""
    name = "ssp_prsc_miles_chabrier_wNE_logGasU-3.0_logGasZ0.0.h5"
    for p in [
        Path("data") / name,
        Path("../data") / name,
        Path("../../data") / name,
        Path("../../../data") / name,
    ]:
        if p.exists():
            return str(p)
    return None


SSP_PATH = _find_ssp()
if SSP_PATH is None:
    raise FileNotFoundError("SSP data not found — skipping example")

ssp_data = load_ssp_data(SSP_PATH)

# Shared galaxy parameters: young, star-forming, no dust
shared_params = dict(
    sfh_tsnorm_log_peak_sfr=Fixed(1.5),
    sfh_tsnorm_peak_lbt_gyr=Fixed(0.5),
    sfh_tsnorm_width_gyr=Fixed(0.5),
    sfh_tsnorm_skew=Fixed(0.0),
    sfh_tsnorm_trunc=Fixed(5.0),
    met_logzsol=Fixed(-0.3),
    dust_tau_bc=Fixed(0.0),
    dust_tau_diff=Fixed(0.0),
    dust_slope=Fixed(-0.7),
    redshift=Fixed(0.0),
)

# --- Backend 1: BakedIn (nebular pre-computed in SSP) ---
spec_baked = Parameters(**shared_params)
model_baked = SEDModel(spec_baked, ssp_data)
params_baked = {k: float(v.value) for k, v in shared_params.items()}
sed_baked = model_baked.predict_rest_sed(params_baked).sed
wave = ssp_data.ssp_wave

# --- Backend 2: CloudyGrid (if available) ---
cloudy_path = next(
    (str(p) for p in [Path("data/cloudy_grid.h5"), Path("../data/cloudy_grid.h5")] if p.exists()),
    None,
)
sed_cloudy = None
if cloudy_path is not None:
    spec_cloudy = Parameters(
        **shared_params,
        nebular=True,
        cloudy_grid_path=cloudy_path,
        neb_logU=Fixed(-3.0),
        neb_logZ_gas=Fixed(-0.3),
    )
    model_cloudy = SEDModel(spec_cloudy, ssp_data)
    params_cloudy = {k: float(v.value) for k, v in shared_params.items()}
    params_cloudy.update({"neb_logU": -3.0, "neb_logZ_gas": -0.3})
    sed_cloudy = model_cloudy.predict_rest_sed(params_cloudy).sed

# --- Plot: optical emission line region ---
fig, axes = plt.subplots(1, 2, figsize=(12, 4.5))

# Panel 1: H-beta + [O III]
regions = [
    (axes[0], 4700, 5100, "H-beta + [O III]", {"H-beta": 4861, "[O III]": 5007}),
    (axes[1], 6400, 6750, "H-alpha Region", {"H-alpha": 6563}),
]

for ax, wmin, wmax, title, lines in regions:
    mask = (wave > wmin) & (wave < wmax)
    ax.plot(
        np.array(wave[mask]), np.array(sed_baked[mask]), "k-", lw=1.2, label="BakedIn (default)"
    )
    if sed_cloudy is not None:
        ax.plot(
            np.array(wave[mask]), np.array(sed_cloudy[mask]), "C1--", lw=1.2, label="CloudyGrid"
        )
    for lbl, lam in lines.items():
        ax.axvline(lam, ls=":", color="C3", lw=0.7, alpha=0.6)
        ax.text(
            lam + 5,
            ax.get_ylim()[1] if ax.get_ylim()[1] > 0 else 1.0,
            lbl,
            fontsize=10,
            color="C3",
            va="top",
        )
    ax.set_xlabel(r"Rest Wavelength [$\AA$]")
    ax.set_ylabel(r"$L_\nu$ [arbitrary]")
    ax.set_title(title)
    ax.legend(frameon=False, fontsize=10)

fig.suptitle("Nebular Emission: Backend Comparison", fontsize=12)
fig.tight_layout(rect=[0, 0, 1, 0.95])
plt.savefig("plot_nebular_backends.png", dpi=150, bbox_inches="tight")
plt.show()

# --- Summary ---
print("Backend comparison:")
print("  BakedIn  : 0 extra params, fastest, fixed logU and Z_gas")
print("  CloudyGrid: 2 extra params (logU, Z_gas), tabulated CLOUDY grids")
print("  Cue      : 12 extra params (abundances), neural net emulator")
if sed_cloudy is None:
    print(f"\n  Note: CloudyGrid not shown (grid file not found at {cloudy_path})")