Note
Go to the end to download the full example code.
Stellar Velocity Dispersion Sweep
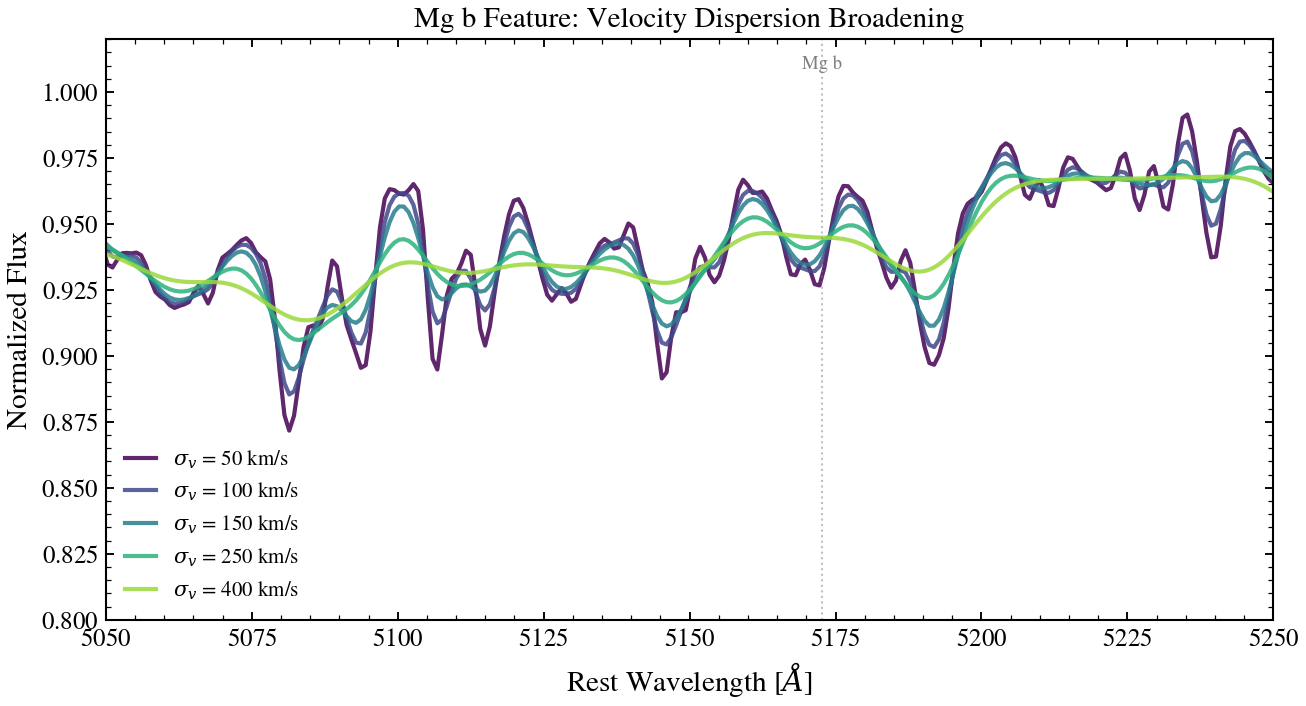
Sweep stellar velocity dispersion σ_v ∈ {50, 100, 150, 250, 400} km/s to show how line broadening increases with dynamical heating. The Mg b absorption feature (~5170 Å) widens progressively, demonstrating the kinematic signature of higher-velocity stellar populations.
import os

os.environ["TF_CPP_MIN_LOG_LEVEL"] = "2"  # suppress XLA/PjRt C++ INFO+WARNING logs

import warnings

import jax
import jax.numpy as jnp
import matplotlib as mpl
import matplotlib.pyplot as plt
import numpy as np

import tengri
from tengri.plot import setup_style

setup_style()
warnings.filterwarnings("ignore", message=".*BakedInBackend.*")

ssp = tengri.load_ssp()

WAVE_OBS = jnp.linspace(4800.0, 5500.0, 300)
REDSHIFT = 0.1

obs = tengri.Observation(
    spectroscopy=tengri.Spectroscopy(wave_obs=WAVE_OBS),
)

# ``sigma_v_kms`` is a "shared" parameter (parameters/_shared.py) with no
# nested-dict-grammar key of its own -- unlike redshift/met_logzsol it is
# reachable through neither a top-level ``SEDModel.build(...)`` kwarg nor any
# group's wildcard, only through the flat ``Parameters`` escape hatch. It is
# swept below (#2296: a params-dict key the spec declared Fixed is refused),
# so build the spec via ``parse_groups`` as ``.build()`` would internally,
# then free it explicitly with ``merge_observation_params`` before
# constructing the model. Bounds pad the 50-400 km/s sweep.
spec = tengri.parse_groups(
    sfh={
        "type": "tsnorm",
        "all_params": tengri.Fixed(tengri.DEFAULT),
        "log_total_mass": 10.0,
        "peak_lbt_gyr": 2.5,
        "width_gyr": 1.8,
        "skew": 0.1,
        "trunc": 3.0,
    },
    dust_attenuation={
        "law": "power_law",
        "type": "two_component",
        "all_params": tengri.Fixed(tengri.DEFAULT),
        "tau_bc": 0.1,
        "tau_diff": 0.05,
        "slope": -0.7,
    },
    redshift=tengri.Fixed(REDSHIFT),
).merge_observation_params(sigma_v_kms=tengri.Uniform(0.0, 500.0))
model = tengri.SEDModel(spec, ssp, observation=obs)

baseline = dict(model.spec.sample(jax.random.PRNGKey(0)))

sigma_v_vals = np.array([50.0, 100.0, 150.0, 250.0, 400.0])
norm = mpl.colors.Normalize(vmin=sigma_v_vals.min(), vmax=sigma_v_vals.max())
cmap = plt.get_cmap("viridis")

fig, ax = plt.subplots(figsize=(7.0, 4.6))

wave_rest = np.linspace(5050.0, 5300.0, 600)
for sigma in sigma_v_vals:
    params = {**baseline, "sigma_v_kms": jnp.float64(sigma)}
    spec_out = model.predict_spectrum(params, wave_obs=wave_rest * (1 + REDSHIFT))
    flux = np.asarray(spec_out)

    cont_mask = (wave_rest >= 5200.0) & (wave_rest <= 5230.0)
    f_cont = np.median(flux[cont_mask])
    ax.plot(wave_rest, flux / f_cont, color=cmap(norm(sigma)), lw=1.2)

ax.axvline(5167.0, color="0.55", lw=0.4, ls=":")
ax.axvline(5173.0, color="0.55", lw=0.4, ls=":")
ax.axvline(5184.0, color="0.55", lw=0.4, ls=":")
ax.text(5175.0, 1.06, "Mg b triplet", fontsize=8, color="0.4", ha="center")

ax.set(
    xlim=(5050, 5300),
    ylim=(0.78, 1.10),
    xlabel=r"Rest-frame wavelength $\lambda$ [$\mathrm{\AA}$]",
    ylabel=r"$F_\lambda\,/\,F_{\rm cont}$ (normalized at 5200-5230 Å)",
)
cb = fig.colorbar(plt.cm.ScalarMappable(norm=norm, cmap=cmap), ax=ax, pad=0.01)
cb.set_label(r"$\sigma_v$  [km s$^{-1}$]")

fig.tight_layout()
plt.savefig("plot_velocity_dispersion_sweep.png", dpi=150, bbox_inches="tight")