Note
Go to the end to download the full example code.
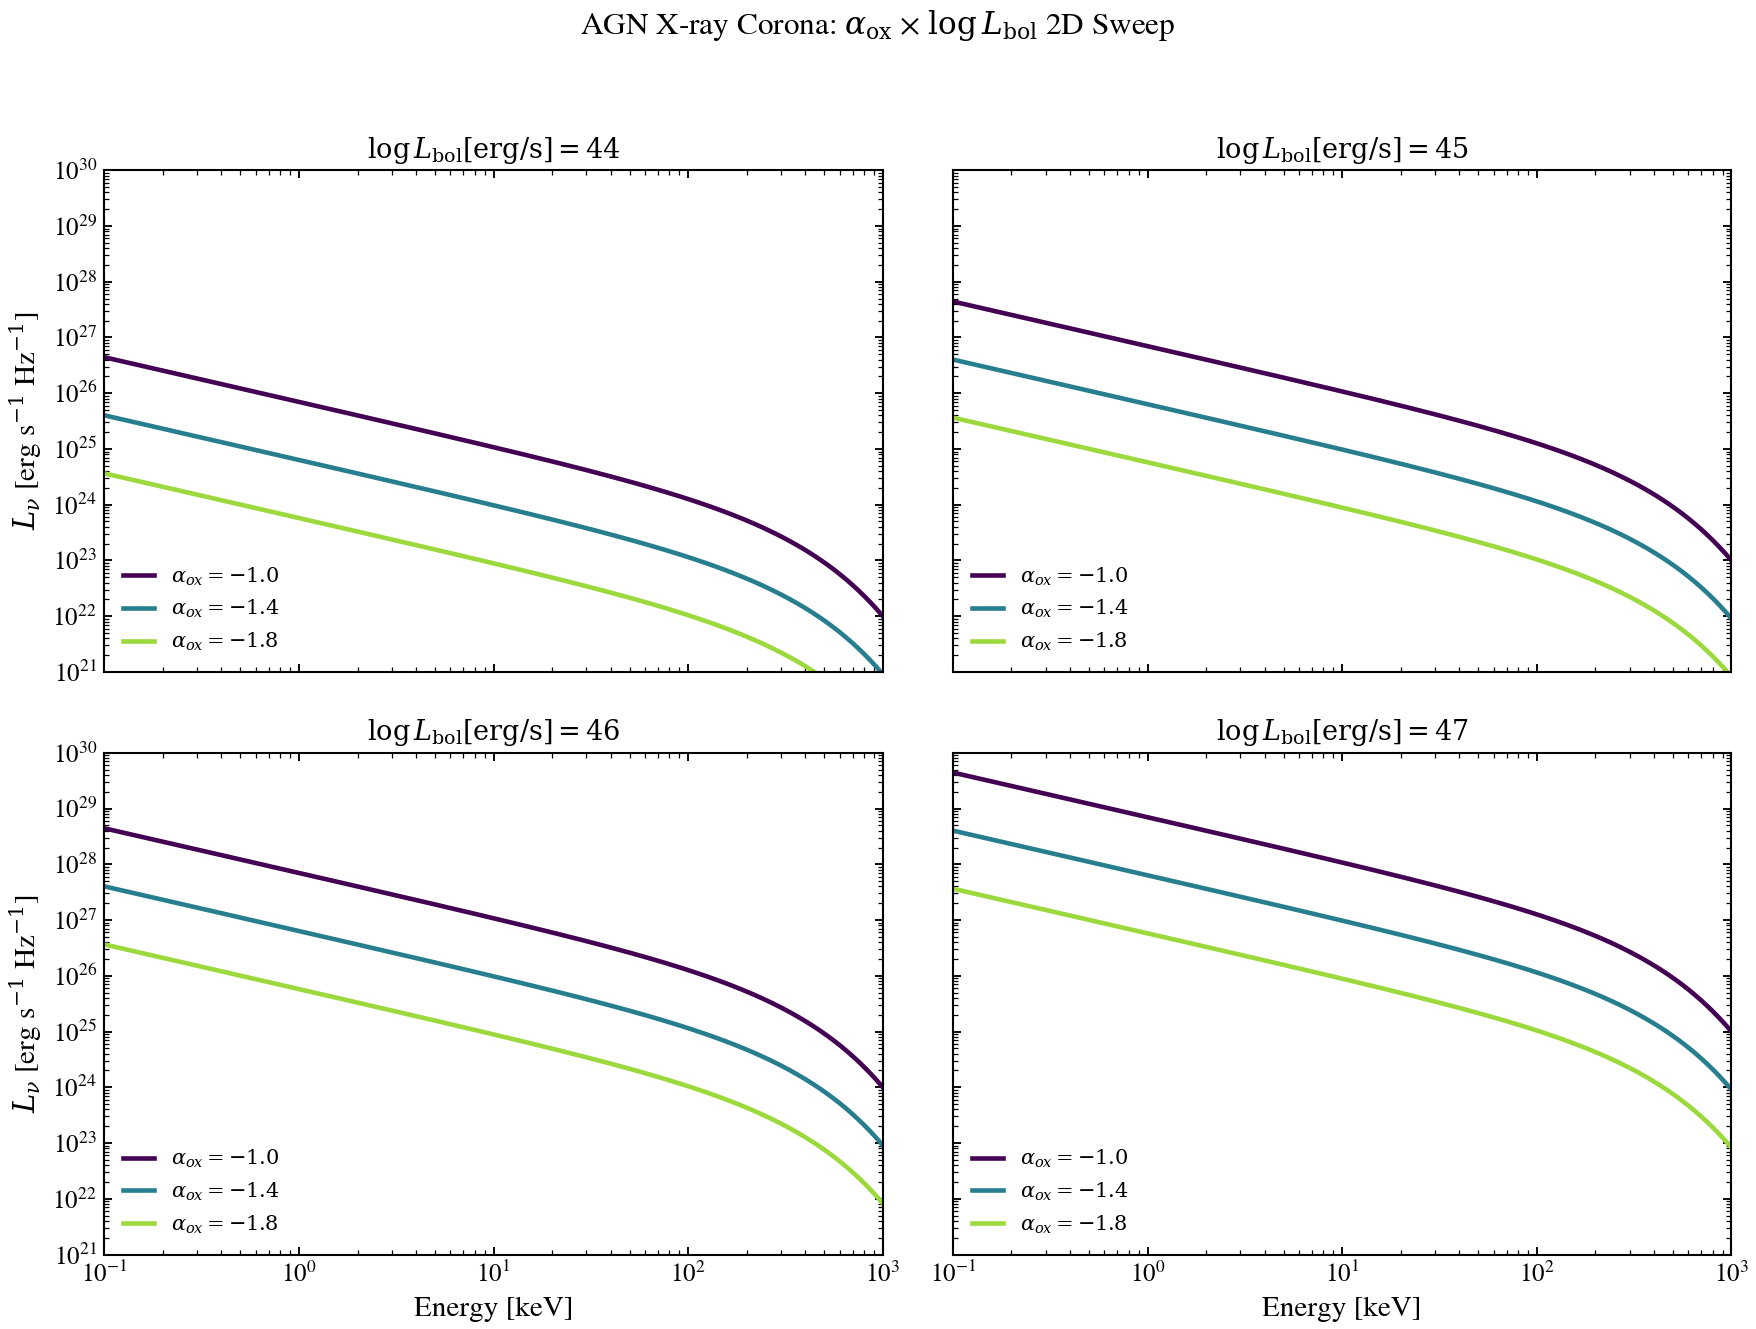
X-ray Corona: Spectral Index vs Bolometric Luminosity 2D Sweep
A 4-panel grid (one panel per log L_bol value) showing how the X-ray corona
spectrum depends jointly on bolometric luminosity and the UV-to-X-ray slope
alpha_ox. Both parameters affect the X-ray normalisation; only alpha_ox
shifts the relative balance between UV and X-ray emission. Sweeps cover the
canonical X-ray band 0.1–1000 keV.
import jax.numpy as jnp
import matplotlib.pyplot as plt
import numpy as np

from tengri.analysis.plotting import setup_style
from tengri.xray import xray_agn_corona

setup_style()

# Wavelength grid covers the function's valid X-ray band (lambda < 124 A,
# i.e. E > 0.1 keV). Conversion: E[keV] = 12.398 / lambda[A].
wavelength = jnp.logspace(np.log10(0.0124), np.log10(124.0), 512)
energy_keV = 12.398 / np.array(wavelength)

# log L_bol expressed in erg/s (the unit xray_agn_corona expects). Typical
# Seyferts ~ 10^44 erg/s, bright quasars ~ 10^46 erg/s.
log_lbol_values = [44, 45, 46, 47]
alpha_ox_values = [-1.0, -1.4, -1.8]

fig, axes = plt.subplots(2, 2, figsize=(12, 9), sharex=True, sharey=True)
axes_flat = axes.flatten()

# Viridis clamped — bright yellow tail (>0.85) is suppressed.
colors = plt.cm.viridis(np.linspace(0.0, 0.85, len(alpha_ox_values)))

for panel_idx, log_lbol in enumerate(log_lbol_values):
    ax = axes_flat[panel_idx]
    L_bol_erg = 10.0**log_lbol  # already in erg/s

    for alpha_ox, color in zip(alpha_ox_values, colors):
        sed = xray_agn_corona(
            wavelength,
            L_agn_bol=L_bol_erg,
            gamma=1.8,
            E_cut=300.0,
            alpha_ox=alpha_ox,
        )
        sed_safe = np.where(np.array(sed) > 0, np.array(sed), np.nan)
        ax.loglog(
            energy_keV, sed_safe, lw=2.2, color=color, label=rf"$\alpha_{{ox}} = {alpha_ox}$"
        )

    ax.set_title(rf"$\log L_{{\mathrm{{bol}}}} [{{\rm erg/s}}] = {log_lbol}$", fontsize=13)
    # Broad axes with breathing room above and below the data — show
    # 6 decades of L_nu range so all alpha_ox curves are visible at every L_bol.
    ax.set_xlim(0.1, 1000)
    ax.set_ylim(1e21, 1e30)
    # Place legend in lower-left where the cutoff drops the curves out of frame.
    ax.legend(fontsize=10, frameon=False, loc="lower left")
    ax.label_outer()

# Add x/y labels only on outer panels (sharex/sharey).
for ax in axes[-1, :]:
    ax.set_xlabel("Energy [keV]")
for ax in axes[:, 0]:
    ax.set_ylabel(r"$L_\nu$ [erg s$^{-1}$ Hz$^{-1}$]")

fig.suptitle(
    r"AGN X-ray Corona: $\alpha_{\rm ox}$ × $\log L_{\rm bol}$ 2D Sweep",
    fontsize=15,
    y=0.995,
)
fig.tight_layout(rect=[0, 0, 1, 0.97])
plt.savefig("plot_agn_alpha_ox_lbol_2d.png", dpi=150, bbox_inches="tight")
plt.show()