Note
Go to the end to download the full example code.
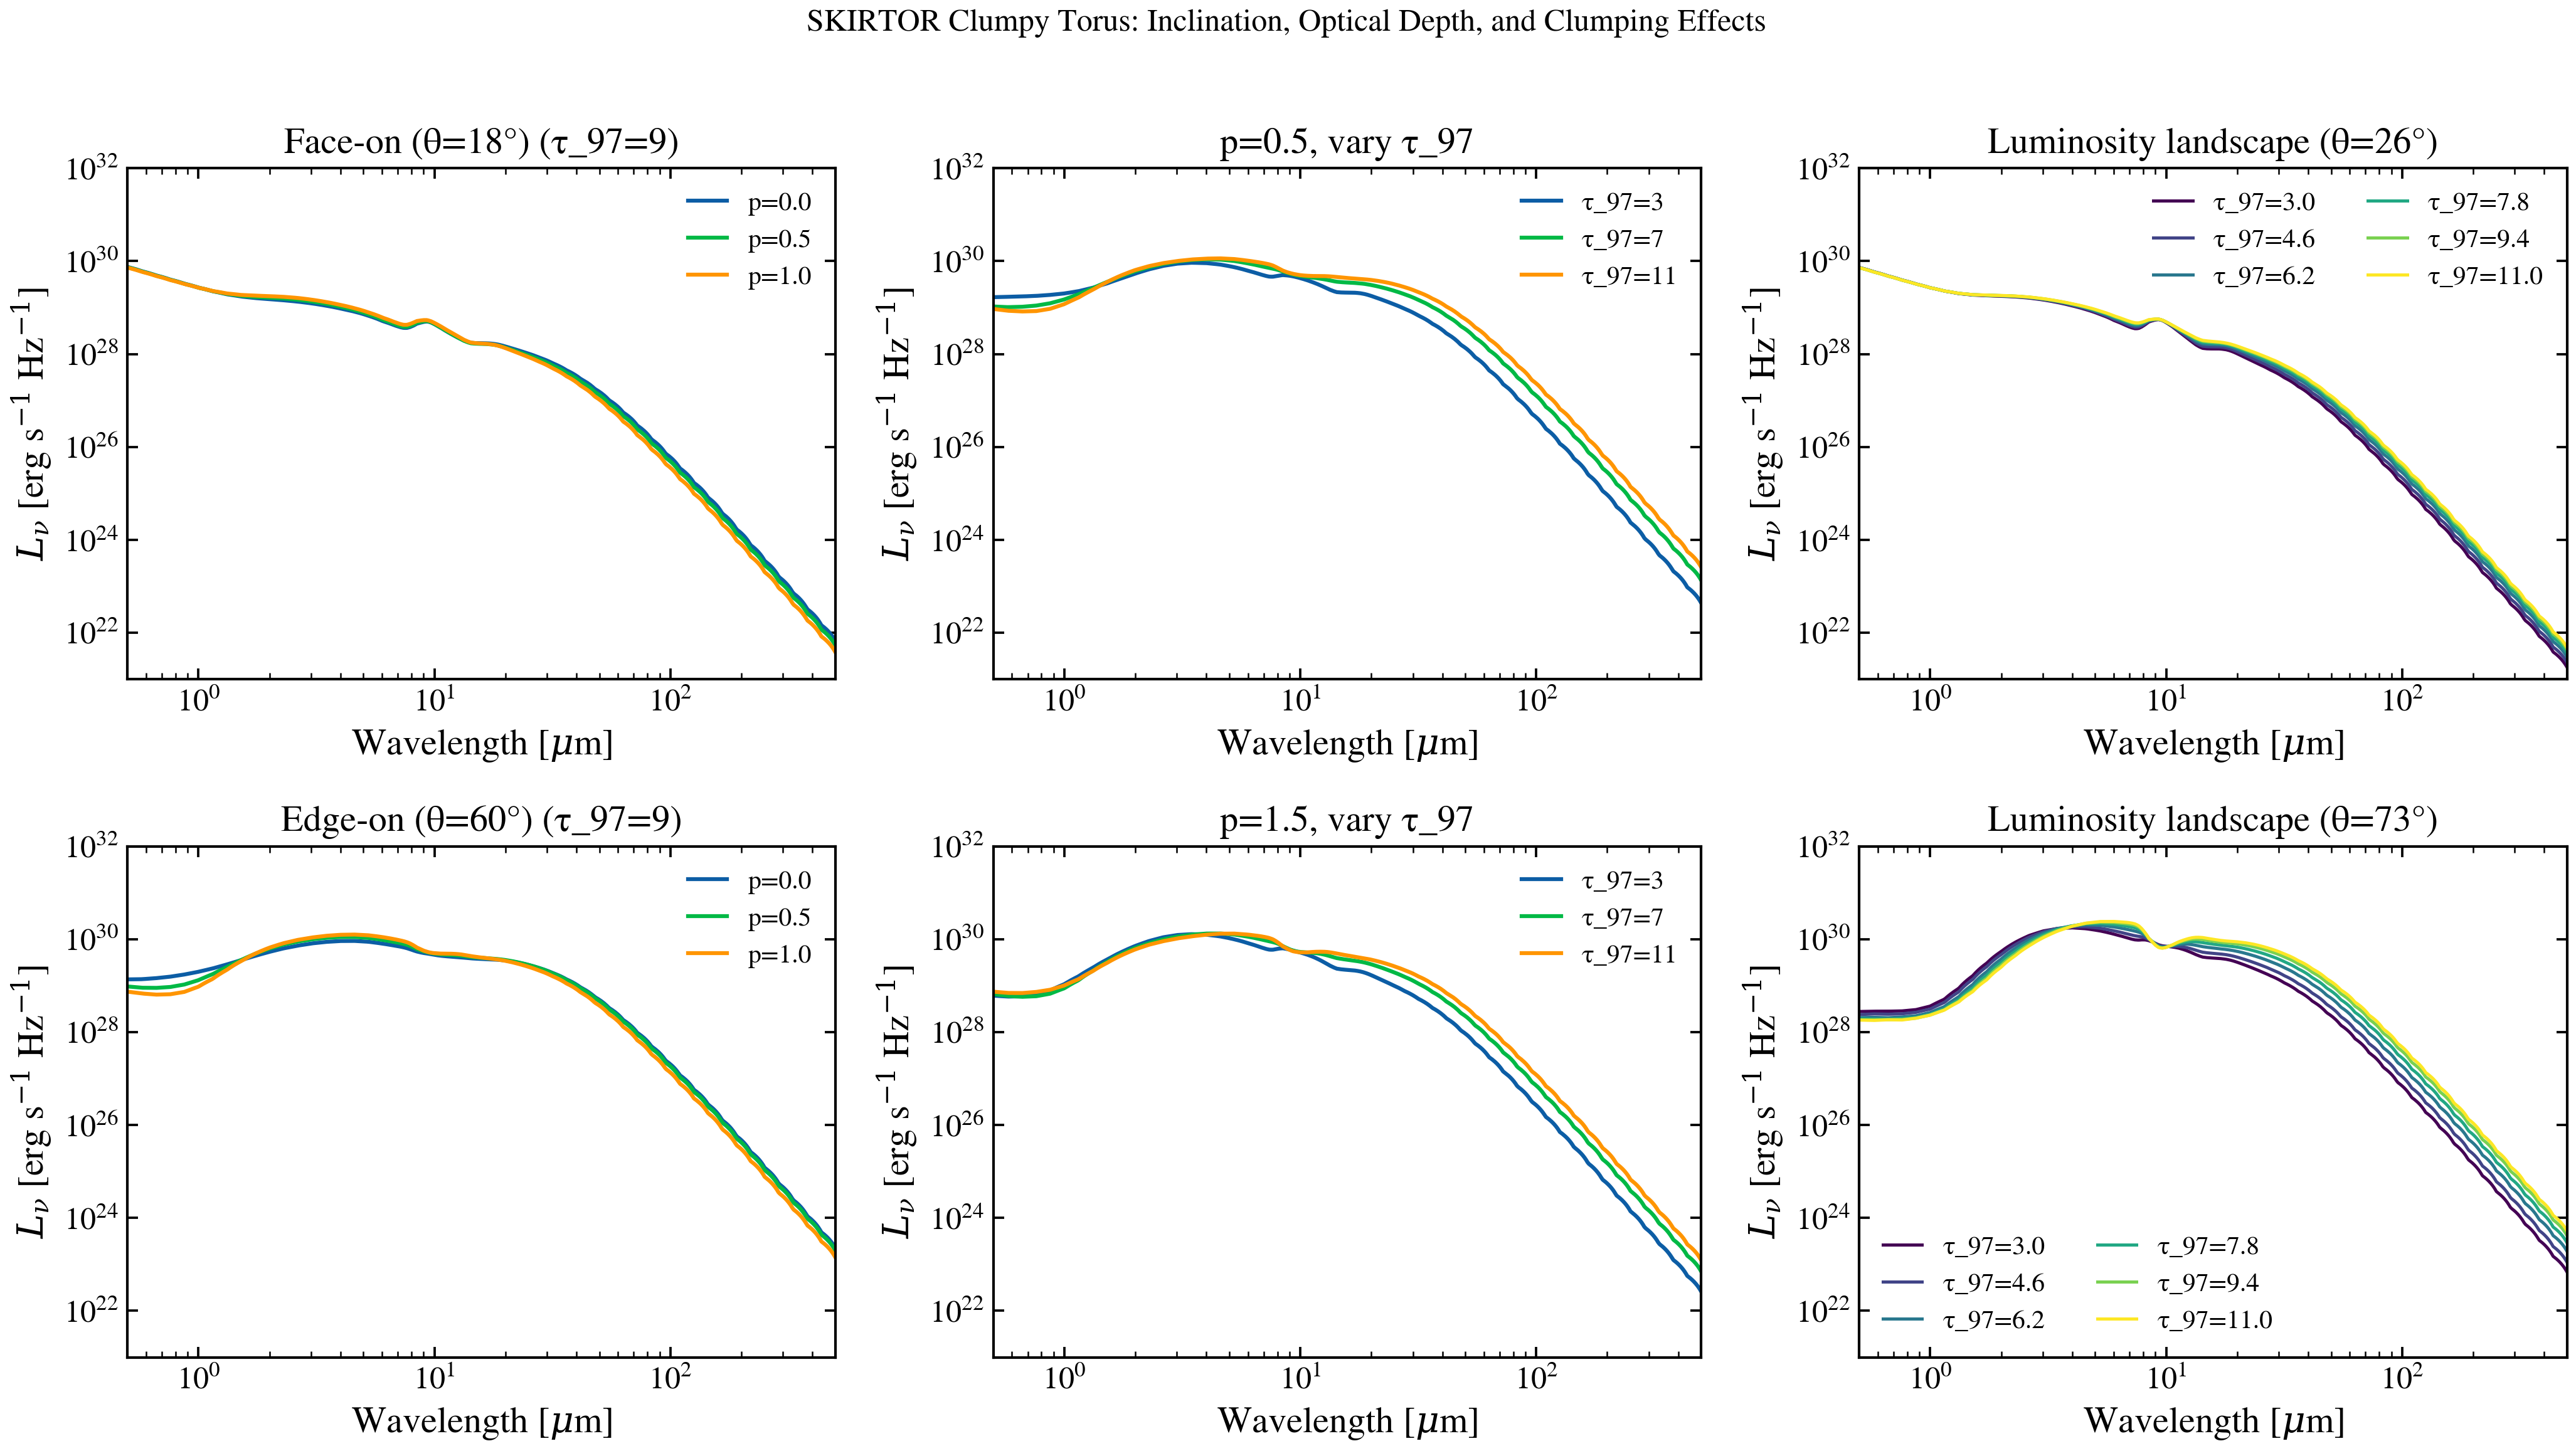
SKIRTOR Clumpy Torus: Inclination and Optical Depth
Plot the SKIRTOR (Stalevski et al. 2016) clumpy torus model varying viewing angle (inclination) and optical depth at 9.7 μm (tau_97). Shows how geometric effects and dust clumping transform the torus SED.
from pathlib import Path

import jax.numpy as jnp
import matplotlib.pyplot as plt
import numpy as np

# Locate SKIRTOR grid file
_grid_path = None
for p in [
    Path("data/skirtor_templates_v3.h5"),
    Path("../data/skirtor_templates_v3.h5"),
    Path("../../data/skirtor_templates_v3.h5"),
    Path("../../../data/skirtor_templates_v3.h5"),
    Path("data/skirtor_templates_v2.h5"),
    Path("../data/skirtor_templates_v2.h5"),
    Path("../../data/skirtor_templates_v2.h5"),
    Path("../../../data/skirtor_templates_v2.h5"),
]:
    if p.exists():
        _grid_path = str(p)
        break

if _grid_path is None:
    raise SystemExit(
        "Skipping: SKIRTOR grid not found. Run: python scripts/download_skirtor_templates.py"
    )

from tengri.analysis.plotting import setup_style
from tengri.components.agn import create_skirtor_from_grid

setup_style()

# Load the SKIRTOR interpolator
skirtor_fn = create_skirtor_from_grid(_grid_path)

# Wavelength grid: 0.5 - 500 micron (IR torus dominated)
wavelength = jnp.logspace(np.log10(5e3), np.log10(5e6), 512)
wave_um = np.array(wavelength) / 1e4

# Figure: 2x3 grid showing tau_97 and inclination variations.
# sharex/sharey keep panel sizes uniform; figsize gives breathing room at 150 dpi
# so individual axis labels and legends remain legible in the gallery.
fig, axes = plt.subplots(2, 3, figsize=(14, 8), sharex=True, sharey=True)

# Left column: fixed tau_97=9 (optically thick, grid max=11), vary inclination
tau_97_thick = 9.0
for ax, cos_inc, title in [
    (axes[0, 0], 0.95, "Face-on (θ=18°)"),
    (axes[1, 0], 0.50, "Edge-on (θ=60°)"),
]:
    seds = []
    labels = []
    for p_frac in [0.0, 0.5, 1.0]:  # radial dust density power p (grid: 0–1.5)
        try:
            sed = skirtor_fn(
                wavelength,
                agn_log_lbol=11.0,
                agn_tau_skirtor=tau_97_thick,
                agn_p_skirtor=p_frac,
                agn_q_skirtor=1.0,
                agn_oa_skirtor=40.0,
                agn_cos_inc=cos_inc,
            )
            seds.append(np.array(sed))
            labels.append(f"p={p_frac:.1f}")
        except Exception:
            continue

    for sed, lbl in zip(seds, labels):
        ax.loglog(wave_um, sed, lw=1.5, label=lbl)

    ax.set_xlabel(r"Wavelength [$\mu$m]")
    ax.set_ylabel(r"$L_\nu$ [erg s$^{-1}$ Hz$^{-1}$]")
    ax.set_title(f"{title} (τ_97={tau_97_thick:.0f})")
    ax.legend(fontsize=10, frameon=False)
    # SKIRTOR torus emission peaks at 10-50 µm; widen with breathing room
    # so context (NIR + sub-mm tails) is visible alongside the IR peak.
    ax.set_xlim(0.5, 500)
    ax.set_ylim(1e25, 1e32)

# Middle column: fixed inclination, vary tau_97
cos_inc_fixed = 0.5
for ax, p_frac, title in [
    (axes[0, 1], 0.5, "p=0.5, vary τ_97"),
    (axes[1, 1], 1.5, "p=1.5, vary τ_97"),
]:
    for tau_97 in [3.0, 7.0, 11.0]:
        try:
            sed = skirtor_fn(
                wavelength,
                agn_log_lbol=11.0,
                agn_tau_skirtor=tau_97,
                agn_p_skirtor=p_frac,
                agn_q_skirtor=1.0,
                agn_oa_skirtor=40.0,
                agn_cos_inc=cos_inc_fixed,
            )
            ax.loglog(wave_um, np.array(sed), lw=1.5, label=f"τ_97={tau_97:.0f}")
        except Exception:
            continue

    ax.set_xlabel(r"Wavelength [$\mu$m]")
    ax.set_ylabel(r"$L_\nu$ [erg s$^{-1}$ Hz$^{-1}$]")
    ax.set_title(title)
    ax.legend(fontsize=10, frameon=False)
    # SKIRTOR torus emission peaks at 10-50 µm; widen with breathing room
    # so context (NIR + sub-mm tails) is visible alongside the IR peak.
    ax.set_xlim(0.5, 500)
    ax.set_ylim(1e25, 1e32)

# Right column: Total SED landscape (3D heatmap as color)
for row, cos_inc in enumerate([0.9, 0.3]):
    ax = axes[row, 2]

    tau_97_vals = np.linspace(3.0, 11.0, 6)
    colors = plt.cm.viridis(np.linspace(0, 1, len(tau_97_vals)))

    for tau_97, color in zip(tau_97_vals, colors):
        try:
            sed = skirtor_fn(
                wavelength,
                agn_log_lbol=11.0,
                agn_tau_skirtor=float(tau_97),
                agn_p_skirtor=1.0,
                agn_q_skirtor=1.0,
                agn_oa_skirtor=40.0,
                agn_cos_inc=cos_inc,
            )
            ax.loglog(
                wave_um,
                np.array(sed),
                lw=1.2,
                color=color,
                label=f"τ_97={tau_97:.1f}",
            )
        except Exception:
            continue

    ax.set_xlabel(r"Wavelength [$\mu$m]")
    ax.set_ylabel(r"$L_\nu$ [erg s$^{-1}$ Hz$^{-1}$]")
    ax.set_title(f"Luminosity landscape (θ={np.degrees(np.arccos(cos_inc)):.0f}°)")
    ax.legend(fontsize=10, frameon=False, ncol=2)
    # SKIRTOR torus emission peaks at 10-50 µm; widen with breathing room
    # so context (NIR + sub-mm tails) is visible alongside the IR peak.
    ax.set_xlim(0.5, 500)
    ax.set_ylim(1e25, 1e32)

# With sharex/sharey, hide tick labels on inner panels so labels don't crowd.
for ax in axes.flat:
    ax.label_outer()

fig.suptitle(
    "SKIRTOR Clumpy Torus: Inclination, Optical Depth, and Clumping Effects",
    fontsize=14,
)
fig.tight_layout(rect=[0, 0, 1, 0.96])
plt.savefig("plot_skirtor_variants.png", dpi=150, bbox_inches="tight")
plt.show()