Note
Go to the end to download the full example code.
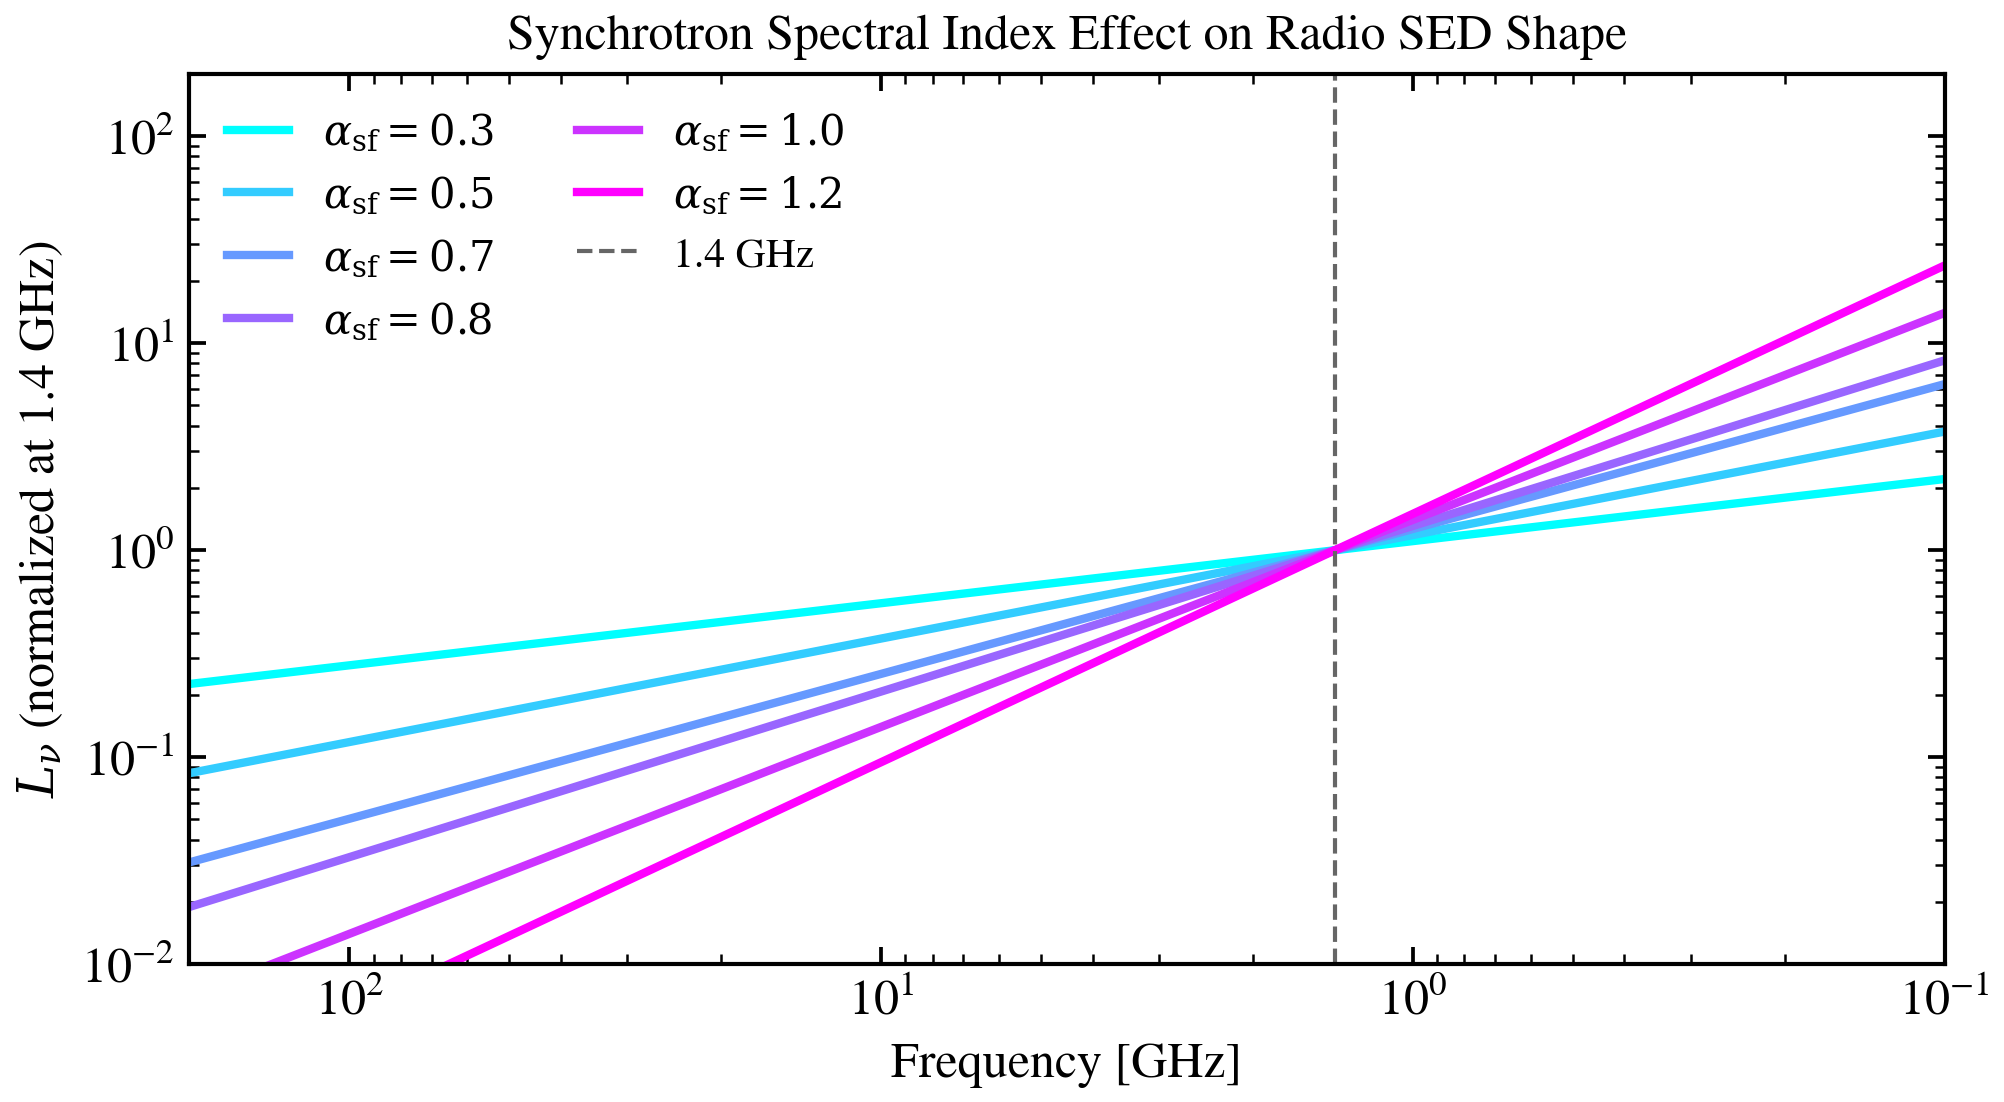
Radio Spectral Index (α_sf)
The synchrotron spectral index \(\alpha_{\rm sf}\) sets how steeply the radio spectrum falls off with frequency. Typical star-forming galaxies have \(\alpha_{\rm sf} \approx 0.7\)–\(0.8\). Flat-spectrum sources (\(\alpha \approx 0\)) have strong free-free contributions; steeper spectra (\(\alpha > 1\)) suggest ageing of the cosmic ray electron population.
import jax
import jax.numpy as jnp
import matplotlib.pyplot as plt
import numpy as np

jax.config.update("jax_enable_x64", True)

from tengri.analysis.plotting import SWEEP_CMAPS, setup_style
from tengri.radio import radio_star_forming

setup_style()

wave = jnp.logspace(7, 11, 600)  # 1 mm – 10 m in Angstrom
L_ir = 1e11  # L_sun

alpha_values = [0.3, 0.5, 0.7, 0.8, 1.0, 1.2]
cmap = plt.get_cmap(SWEEP_CMAPS["radio"])
colors = [cmap(i / max(len(alpha_values) - 1, 1)) for i in range(len(alpha_values))]

fig, ax = plt.subplots(figsize=(7, 4))

# Normalize at 1.4 GHz for clean comparison
nu_ref_aa = 3e18 / 1.4e9  # 1.4 GHz in Angstrom
for alpha, color in zip(alpha_values, colors):
    L_nu = radio_star_forming(wave, L_ir=L_ir, q_ir=2.64, alpha_sf=alpha)
    L_nu_ref = radio_star_forming(jnp.array([nu_ref_aa]), L_ir=L_ir, q_ir=2.64, alpha_sf=0.8)
    L_nu_norm = np.array(L_nu) / float(L_nu_ref[0])
    nu_ghz = (3e18 / np.array(wave)) / 1e9
    ax.loglog(nu_ghz, L_nu_norm, color=color, lw=2.0, label=rf"$\alpha_{{\rm sf}}={alpha}$")

ax.axvline(1.4, color="0.4", lw=1.0, ls="--", label="1.4 GHz")
ax.set_xlabel("Frequency [GHz]", fontsize=12)
ax.set_ylabel(r"$L_\nu$ (normalized at 1.4 GHz)", fontsize=12)
ax.invert_xaxis()
ax.set_xlim(200, 0.1)
ax.set_ylim(0.01, 200)
ax.legend(fontsize=10, frameon=False, ncol=2)
ax.set_title("Synchrotron Spectral Index Effect on Radio SED Shape", fontsize=12)
plt.tight_layout()
plt.savefig("plot_alpha_sf_sweep.png", dpi=150, bbox_inches="tight")
plt.show()