Note
Go to the end to download the full example code.
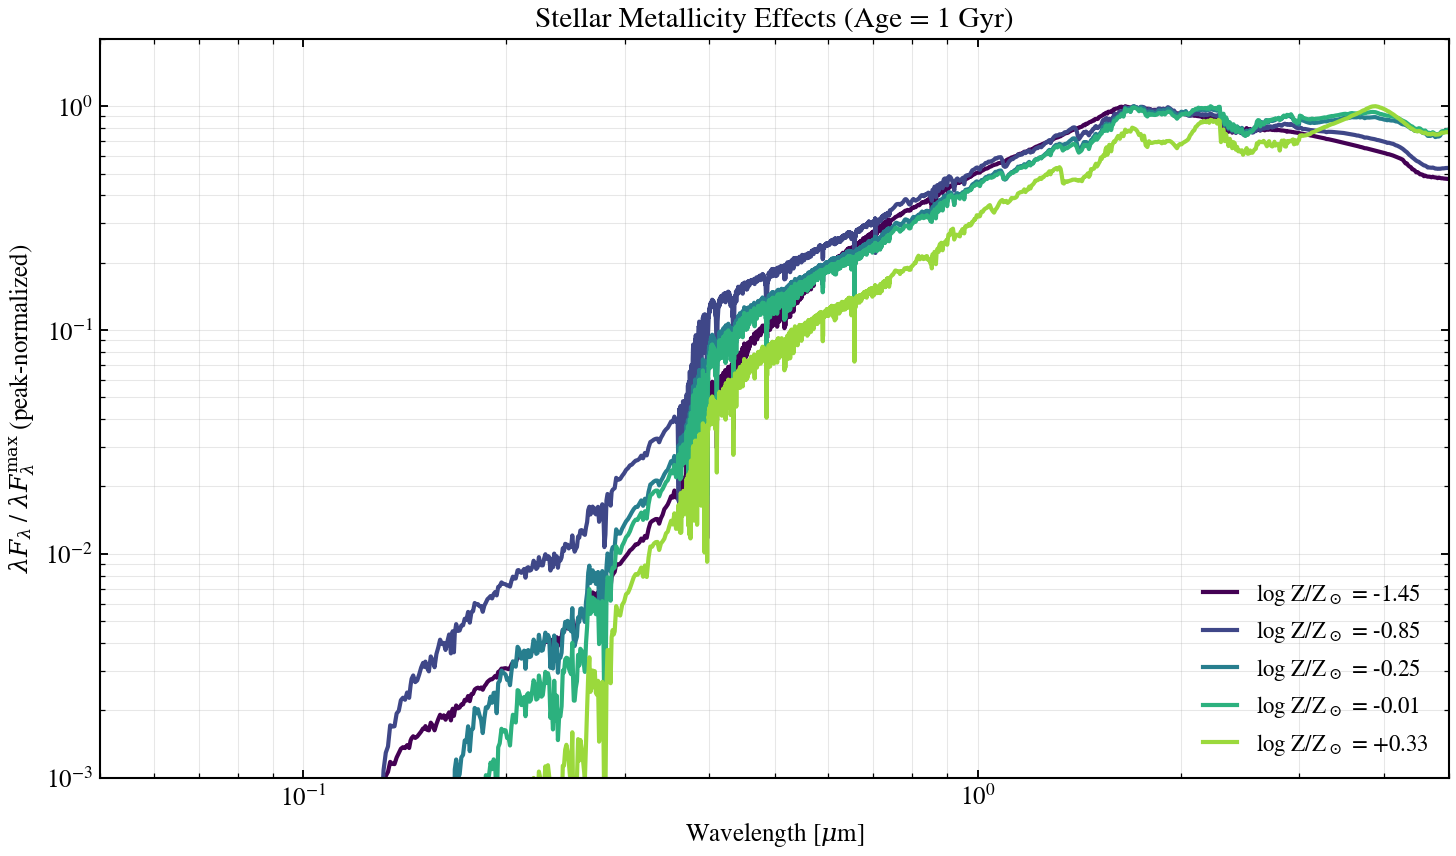
Stellar Metallicity Effects on SED
Five metallicity points spanning the SSP grid at fixed age (1 Gyr). Metallicity reddens the optical and shifts iron-peak features in the near-IR; we plot peak-normalised λF_λ to compare shape, not normalisation.
from pathlib import Path

import matplotlib

matplotlib.use("Agg")
import matplotlib.pyplot as plt
import numpy as np

from tengri import load_ssp_data
from tengri.analysis.plotting import setup_style

setup_style()


def _find_ssp():
    """Find SSP data file in standard locations."""
    name = "ssp_prsc_miles_chabrier_wNE_logGasU-3.0_logGasZ0.0.h5"
    for p in [
        Path("data") / name,
        Path("../data") / name,
        Path("../../data") / name,
        Path("../../../data") / name,
    ]:
        if p.exists():
            return str(p)
    return None


ssp_path = _find_ssp()
if ssp_path is None:
    raise FileNotFoundError("SSP data not found — skipping example")

ssp_data = load_ssp_data(ssp_path)

# Extract grid
age_gyr = 10 ** np.array(ssp_data.ssp_lg_age_gyr)
log_z = np.array(ssp_data.ssp_lgmet)
ssp_wave = np.array(ssp_data.ssp_wave)
ssp_spec = np.array(ssp_data.ssp_flux)  # Shape: (n_z, n_age, n_wave)

# Fixed age: 1 Gyr
age_idx = np.argmin(np.abs(age_gyr - 1.0))

# Select 5 metallicities spanning the grid. ssp_lgmet stores absolute
# log10(Z); convert user-friendly log(Z/Zsun) targets via LOG10_ZSUN so
# the requested values land on distinct grid points instead of all
# clipping to the grid maximum.
LOG10_ZSUN = -1.848
log_zsol_targets = [-1.5, -1.0, -0.3, 0.0, 0.3]
log_z_targets = [t + LOG10_ZSUN for t in log_zsol_targets]
met_indices = [np.argmin(np.abs(log_z - t)) for t in log_z_targets]
met_labels = [f"log Z/Z$_\\odot$ = {log_z[i] - LOG10_ZSUN:+.2f}" for i in met_indices]

# Clamp viridis colormap to 0.0–0.85
colors = plt.cm.viridis(np.linspace(0.0, 0.85, len(met_indices)))

fig, ax = plt.subplots(figsize=(10, 6))

# Plot each metallicity — peak-normalize to focus on shape changes
for met_idx, met_lbl, color in zip(met_indices, met_labels, colors):
    spec = np.asarray(ssp_spec[met_idx, age_idx, :])
    lambda_f_lambda = ssp_wave * spec
    # Mask zero/negative entries before normalizing
    safe = np.where(lambda_f_lambda > 0, lambda_f_lambda, np.nan)
    norm = np.nanmax(safe)
    ax.loglog(ssp_wave / 1e4, safe / norm, lw=2.0, color=color, label=met_lbl)

ax.set_xlabel(r"Wavelength [$\mu$m]", fontsize=12)
ax.set_ylabel(
    r"$\lambda F_\lambda$ / $\lambda F_\lambda^{\rm max}$ (peak-normalized)",
    fontsize=12,
)
ax.set_title(r"Stellar Metallicity Effects (Age = 1 Gyr)", fontsize=14)
ax.legend(fontsize=11, frameon=False, loc="lower right")
ax.grid(True, alpha=0.3, which="both")
# Zoom to UV-NIR where stellar features dominate
ax.set_xlim(0.05, 5.0)
ax.set_ylim(1e-3, 2.0)

fig.tight_layout()
# Save to script directory
script_dir = Path(__file__).resolve().parent if "__file__" in dir() else Path(".")
plt.savefig(str(script_dir / "plot_ssp_metallicity_sweep.png"), dpi=150, bbox_inches="tight")
plt.close()