Note
Go to the end to download the full example code.
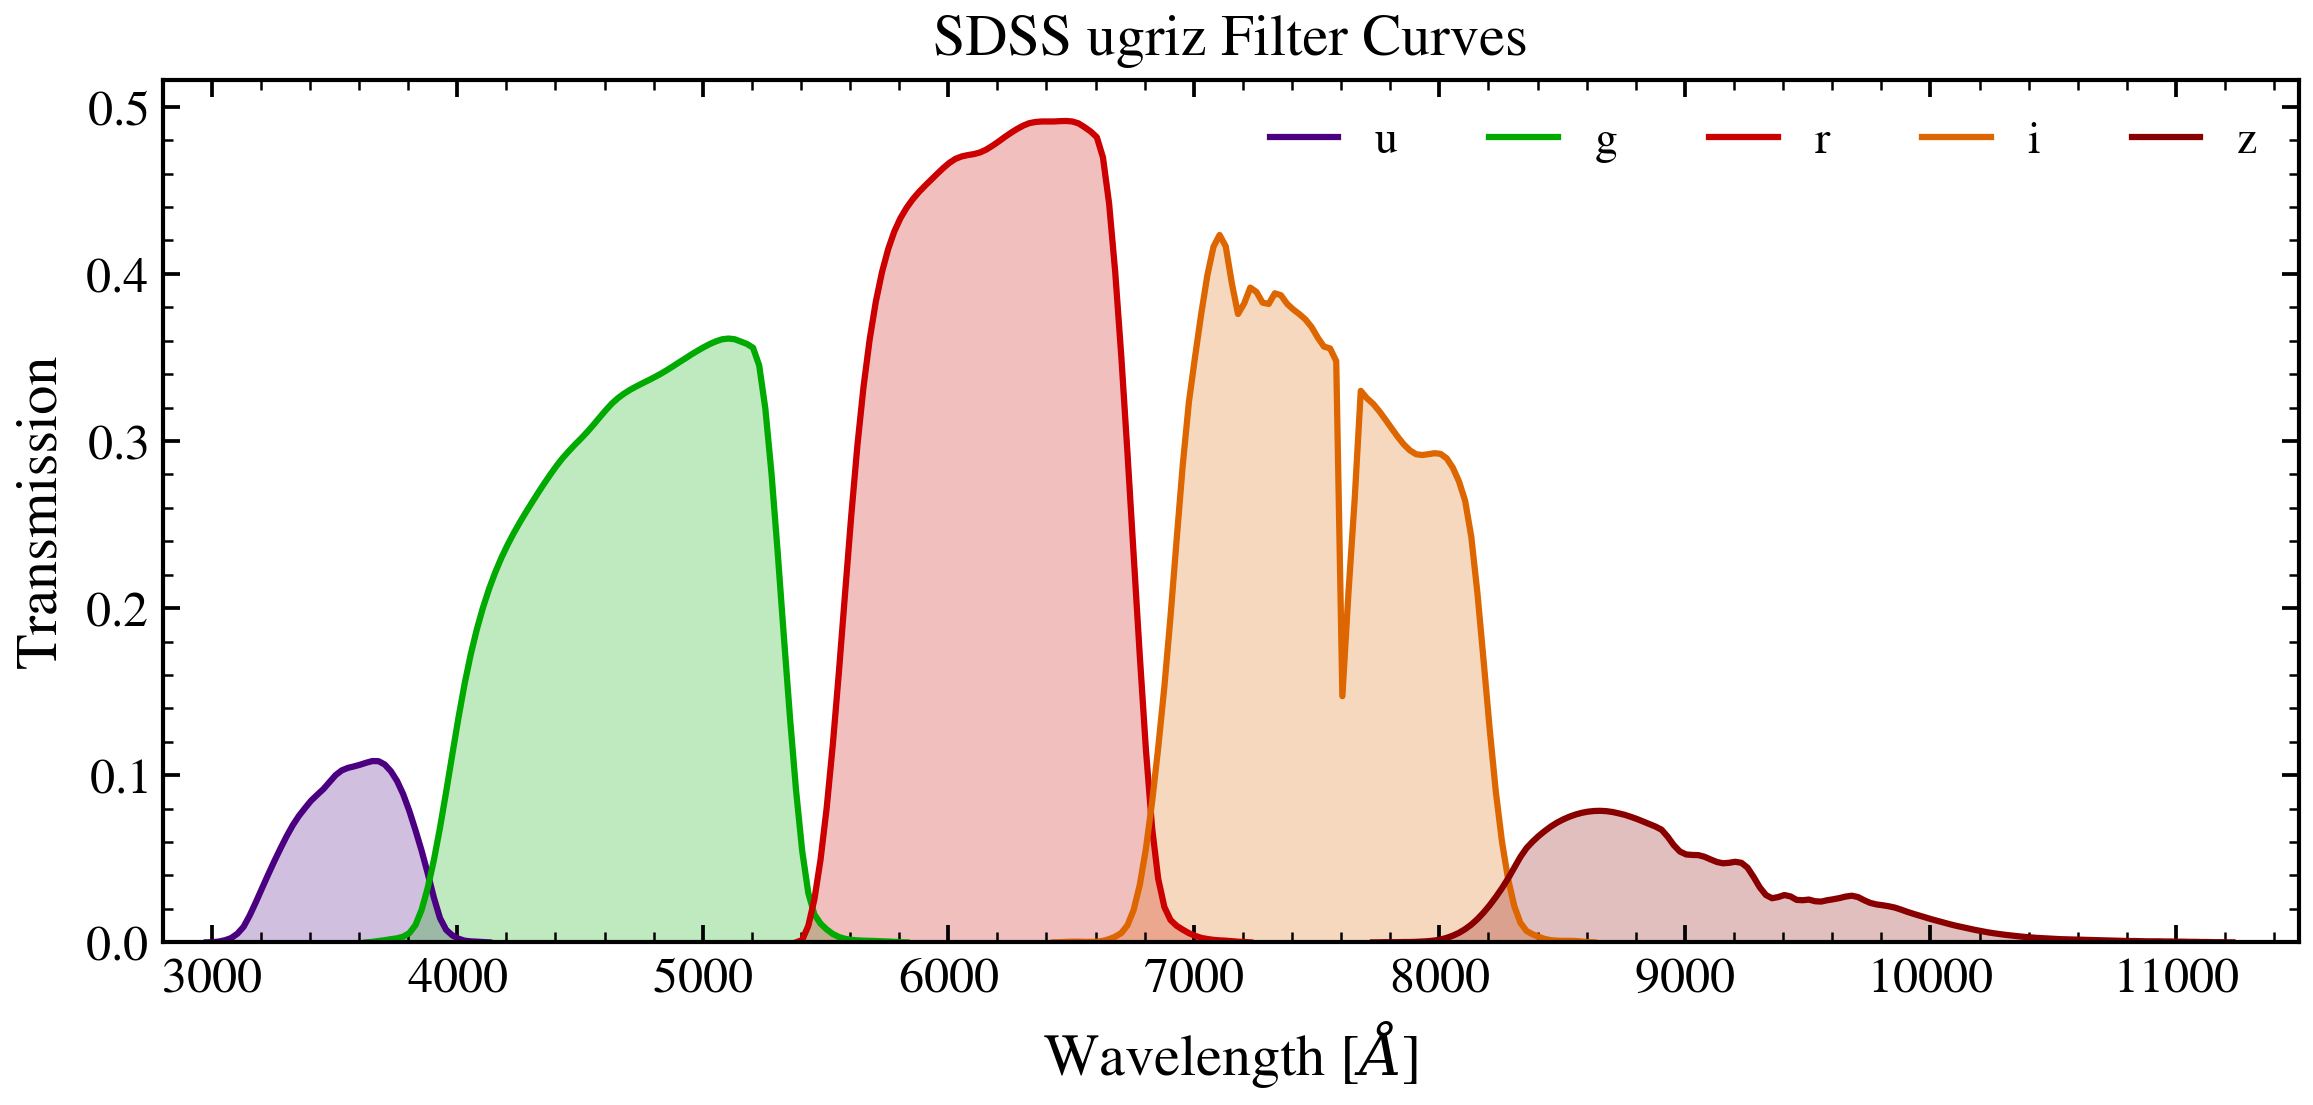
SDSS Filter Transmission Curves
Plot the ugriz filter transmission curves from the SDSS photometric system. Filters are loaded from the SVO Filter Profile Service via tengri’s filter registry.
from pathlib import Path

import matplotlib.pyplot as plt
import numpy as np

from tengri import load_filter_set
from tengri.analysis.plotting import setup_style

setup_style()

# Locate filter cache — works from project root or sphinx-gallery cwd
_FILTER_DIRS = [
    Path("data/filters"),
    Path("../data/filters"),
    Path("../../data/filters"),
    Path("../../../data/filters"),
]
cache_dir = next((d for d in _FILTER_DIRS if d.exists()), "data/filters")

# Load SDSS ugriz filters
filter_names = ["sdss_u", "sdss_g", "sdss_r", "sdss_i", "sdss_z"]
_waves, _trans, curves = load_filter_set(filter_names, cache_dir=str(cache_dir))

# Band colors matching standard SDSS convention
band_colors = {
    "sdss_u": "#4B0082",
    "sdss_g": "#00AA00",
    "sdss_r": "#CC0000",
    "sdss_i": "#DD6600",
    "sdss_z": "#880000",
}

fig, ax = plt.subplots(figsize=(8, 4))

for fc, name in zip(curves, filter_names):
    wave_ang = np.array(fc.wave)
    trans = np.array(fc.trans)
    color = band_colors[name]
    ax.fill_between(wave_ang, 0, trans, alpha=0.25, color=color)
    ax.plot(wave_ang, trans, lw=1.5, color=color, label=name.replace("sdss_", ""))

ax.set_xlabel(r"Wavelength [$\AA$]")
ax.set_ylabel("Transmission")
ax.set_title("SDSS ugriz Filter Curves")
ax.set_xlim(2800, 11500)
ax.set_ylim(0, None)
ax.legend(frameon=False, ncol=5, loc="upper right")
fig.tight_layout()

plt.savefig("plot_filter_curves.png", dpi=150, bbox_inches="tight")
plt.show()