Note
Go to the end to download the full example code.
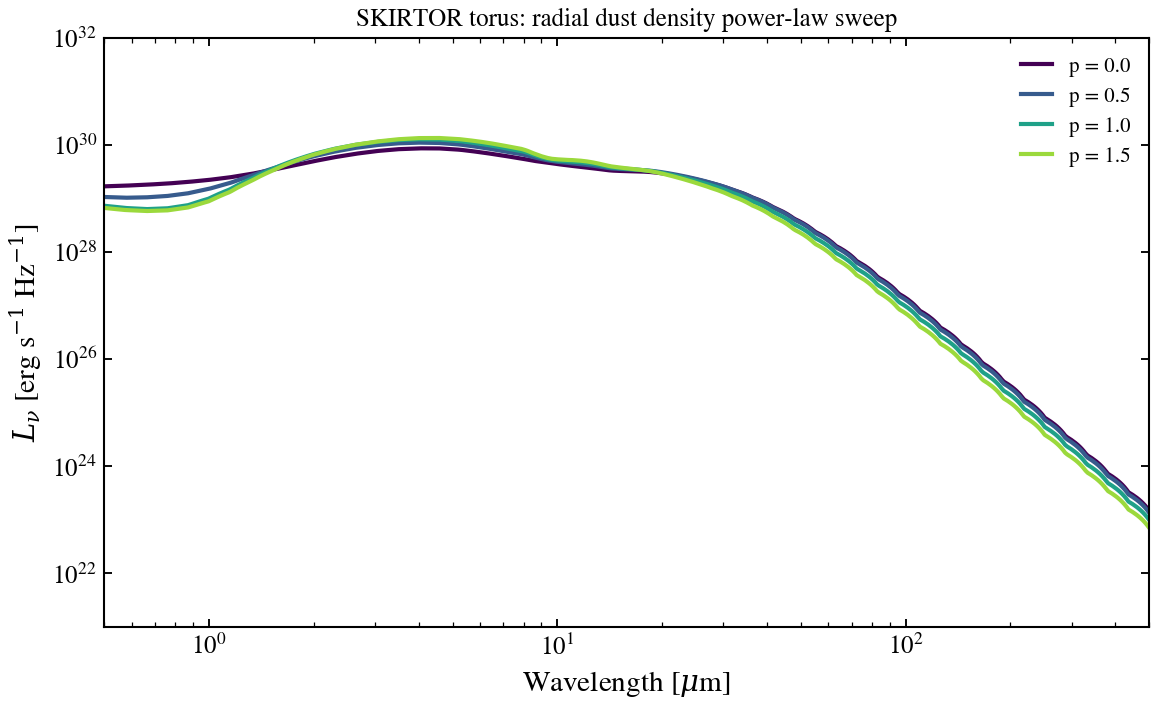
SKIRTOR Torus: Radial Dust Power-Law Sweep
Sweep the radial dust density power index p from 0.0 to 1.5 at fixed inclination = 0.5 and τ₉.₇ = 7. Steeper profiles concentrate the dust closer to the disc and push the mid-to-far-IR peak hotter.
from pathlib import Path

import jax.numpy as jnp
import matplotlib.pyplot as plt
import numpy as np

# Locate SKIRTOR grid file
_grid_path = None
for p in [
    Path("data/skirtor_templates_v3.h5"),
    Path("../data/skirtor_templates_v3.h5"),
    Path("../../data/skirtor_templates_v3.h5"),
    Path("../../../data/skirtor_templates_v3.h5"),
    Path("data/skirtor_templates_v2.h5"),
    Path("../data/skirtor_templates_v2.h5"),
    Path("../../data/skirtor_templates_v2.h5"),
    Path("../../../data/skirtor_templates_v2.h5"),
]:
    if p.exists():
        _grid_path = str(p)
        break

if _grid_path is None:
    raise SystemExit(
        "Skipping: SKIRTOR grid not found. Run: python scripts/download_skirtor_templates.py"
    )

from tengri.analysis.plotting import setup_style
from tengri.components.agn import create_skirtor_from_grid

setup_style()

# Load the SKIRTOR interpolator
skirtor_fn = create_skirtor_from_grid(_grid_path)

# Wavelength grid: mid-IR to far-IR torus region
wavelength = jnp.logspace(np.log10(5e3), np.log10(5e6), 512)
wave_um = np.array(wavelength) / 1e4

# Radial power-law index values to sweep
p_values = [0.0, 0.5, 1.0, 1.5]

# Create figure with single panel
fig, ax = plt.subplots(figsize=(8, 5))

# Generate colors from colormap
colors = plt.cm.viridis(np.linspace(0.0, 0.85, len(p_values)))

# Fixed parameters
agn_log_lbol = 11.0
agn_tau_skirtor = 7.0
agn_q_skirtor = 1.0
agn_oa_skirtor = 40.0
cos_inc = 0.5  # 60 degrees inclination

# Sweep radial power index
for p_val, color in zip(p_values, colors):
    try:
        sed = skirtor_fn(
            wavelength,
            agn_log_lbol=agn_log_lbol,
            agn_tau_skirtor=agn_tau_skirtor,
            agn_p_skirtor=float(p_val),
            agn_q_skirtor=agn_q_skirtor,
            agn_oa_skirtor=agn_oa_skirtor,
            agn_cos_inc=cos_inc,
        )
        ax.loglog(wave_um, np.array(sed), lw=2.0, color=color, label=rf"p = {p_val}")
    except Exception:
        continue

ax.set_xlabel(r"Wavelength [$\mu$m]")
ax.set_ylabel(r"$L_\nu$ [erg s$^{-1}$ Hz$^{-1}$]")
ax.set_title("SKIRTOR torus: radial dust density power-law sweep", fontsize=12)
ax.legend(fontsize=10, frameon=False, loc="best")
ax.set_xlim(0.5, 500)
ax.set_ylim(1e21, 1e32)
ax.grid(False)

fig.tight_layout()
plt.savefig("plot_agn_skirtor_p_sweep.png", dpi=150, bbox_inches="tight")
plt.show()