Note
Go to the end to download the full example code.
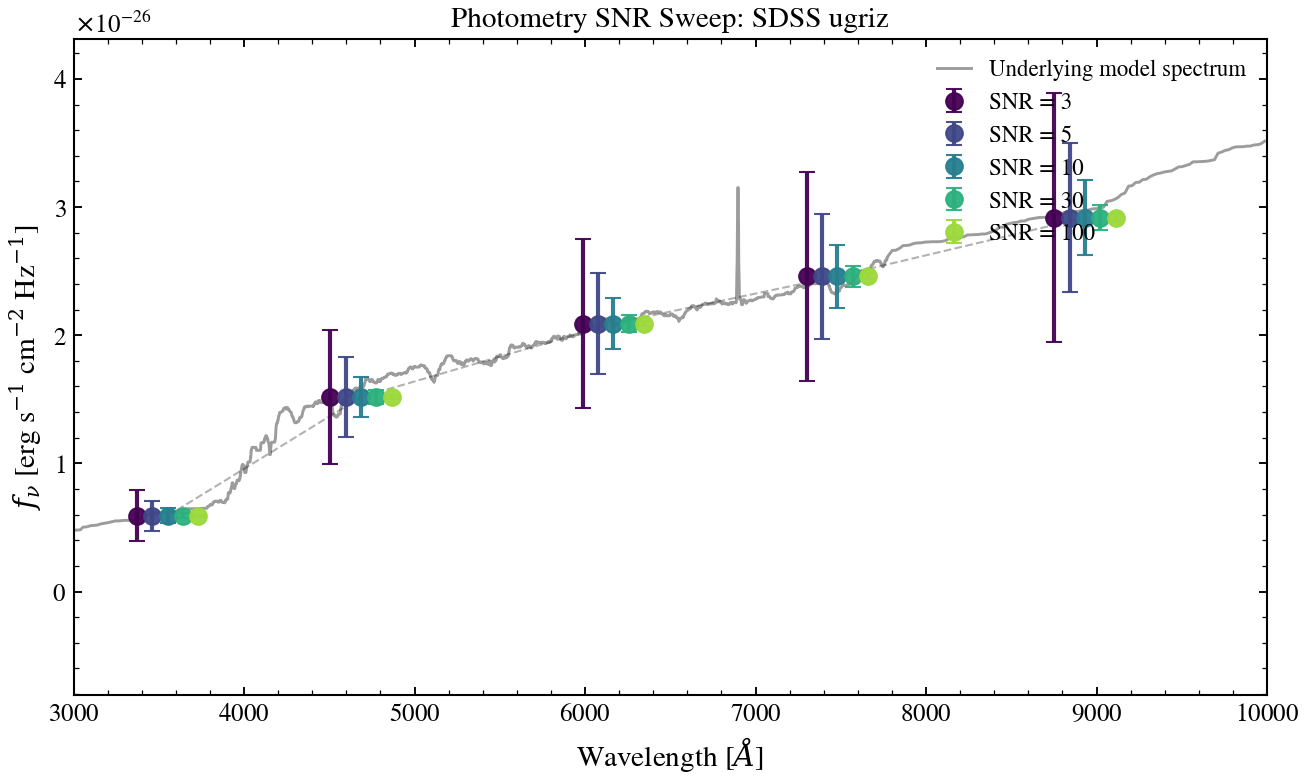
S/N Ratio Parameter Sweep
Sweep signal-to-noise ratio (SNR) from {3, 5, 10, 30, 100} on a fixed mock photometric galaxy in SDSS ugriz. Demonstrates how measurement uncertainty affects photometric precision. Higher SNR = tighter error bars.
from pathlib import Path

import jax
import matplotlib.pyplot as plt
import numpy as np

from tengri import (
    Fixed,
    Observation,
    Parameters,
    Photometry,
    SEDModel,
    load_ssp_data,
)
from tengri.analysis.plotting import setup_style

setup_style()


def _find_ssp():
    """Locate SSP data from project root or docs/ (sphinx-gallery) cwd."""
    name = "ssp_prsc_miles_chabrier_wNE_logGasU-3.0_logGasZ0.0.h5"
    for p in [
        Path("data") / name,
        Path("../data") / name,
        Path("../../data") / name,
        Path("../../../data") / name,
    ]:
        if p.exists():
            return str(p)
    return None


SSP_PATH = _find_ssp()
_FILTER_DIR = next(
    (
        str(d)
        for d in [
            Path("data/filters"),
            Path("../data/filters"),
            Path("../../data/filters"),
            Path("../../../data/filters"),
        ]
        if d.exists()
    ),
    "data/filters",
)
if SSP_PATH is None:
    raise FileNotFoundError("SSP data not found — skipping example")

# --- Setup ---
ssp_data = load_ssp_data(SSP_PATH)
bands = ["sdss_u", "sdss_g", "sdss_r", "sdss_i", "sdss_z"]
obs = Observation(
    photometry=Photometry.from_names(bands, cache_dir=_FILTER_DIR),
)

spec = Parameters(
    sfh_tsnorm_log_peak_sfr=Fixed(1.0),
    sfh_tsnorm_peak_lbt_gyr=Fixed(3.0),
    sfh_tsnorm_width_gyr=Fixed(2.0),
    sfh_tsnorm_skew=Fixed(0.3),
    sfh_tsnorm_trunc=Fixed(3.0),
    met_logzsol=Fixed(-0.1),
    dust_tau_bc=Fixed(0.5),
    dust_tau_diff=Fixed(0.3),
    dust_slope=Fixed(-0.7),
    redshift=Fixed(0.05),
)
model = SEDModel(spec, ssp_data, observation=obs)

# --- Generate mock data once ---
true_params = spec.sample(jax.random.PRNGKey(42))
mock_fiducial = model.mock(true_params, snr=30.0, key=jax.random.PRNGKey(0))

# --- Plot SNR sweep ---
snr_values = [3, 5, 10, 30, 100]
colors = plt.cm.viridis(np.linspace(0.0, 0.85, len(snr_values)))

fig, ax = plt.subplots(figsize=(9, 5.5))

wave_eff = np.array([3551, 4686, 6166, 7480, 8932])  # SDSS effective wavelengths
flux = np.asarray(mock_fiducial.flux_obs)

# Show the underlying model spectrum behind the broadband points so the
# user can see what the bands are sampling. Convert L_nu (rest-frame) to
# observed-frame f_nu (1+z scaling); use the same z=0.05 as the model.
pred = model.predict_rest_sed(true_params)
wave_rest = np.asarray(pred.wavelength)
sed_rest = np.asarray(pred.sed)
# Crude rest -> observed wavelength shift; scale to match photometry magnitude.
z_eff = 0.05
wave_spec_obs = wave_rest * (1.0 + z_eff)
# Smooth the spectrum for visualization (drop emission-line spikes).
from scipy.ndimage import median_filter

sed_smooth = median_filter(sed_rest, size=51)
spec_mask = (wave_spec_obs >= 3000) & (wave_spec_obs <= 10000)
# Normalize the spectrum so its r-band value matches the photometric r-band flux.
r_band_idx = np.argmin(np.abs(wave_spec_obs[spec_mask] - 6166))
sed_at_r = sed_smooth[spec_mask][r_band_idx]
phot_r = flux[2]  # r is index 2 in ugriz
spec_scaled = sed_smooth[spec_mask] * (phot_r / sed_at_r)
ax.plot(
    wave_spec_obs[spec_mask],
    spec_scaled,
    color="0.45",
    lw=1.4,
    alpha=0.7,
    zorder=1,
    label="Underlying model spectrum",
)
# Light line connecting photometry points for shape context.
ax.plot(wave_eff, flux, "k--", lw=1.0, alpha=0.3, zorder=1)

# Plot each SNR with a small horizontal offset so error bars don't overlap.
n_snr = len(snr_values)
offsets = np.linspace(-180, 180, n_snr)

for snr, color, dx in zip(snr_values, colors, offsets):
    scale = 30.0 / snr
    noise_scaled = np.array(mock_fiducial.noise) * scale

    ax.errorbar(
        wave_eff + dx,
        flux,
        yerr=noise_scaled,
        fmt="o",
        ms=8,
        capsize=4,
        color=color,
        ecolor=color,
        label=f"SNR = {snr}",
        lw=2.0,
        elinewidth=2.0,
        alpha=0.95,
        zorder=3,
    )

ax.set_xlabel(r"Wavelength [$\AA$]")
ax.set_ylabel(r"$f_\nu$ [erg s$^{-1}$ cm$^{-2}$ Hz$^{-1}$]")
ax.set_title("Photometry SNR Sweep: SDSS ugriz")
ax.set_xlim(3000, 10000)
# Auto y-limits with breathing room above/below the data + max error-bar.
y_lo = np.min(flux) - np.max(np.array(mock_fiducial.noise)) * (30.0 / 3.0)
y_hi = np.max(flux) + np.max(np.array(mock_fiducial.noise)) * (30.0 / 3.0)
ax.set_ylim(y_lo - 0.1 * abs(y_hi - y_lo), y_hi + 0.1 * abs(y_hi - y_lo))
ax.legend(frameon=False, loc="upper right")
fig.tight_layout()
plt.savefig("plot_snr_sweep.png", dpi=150, bbox_inches="tight")
plt.show()