Note
Go to the end to download the full example code.
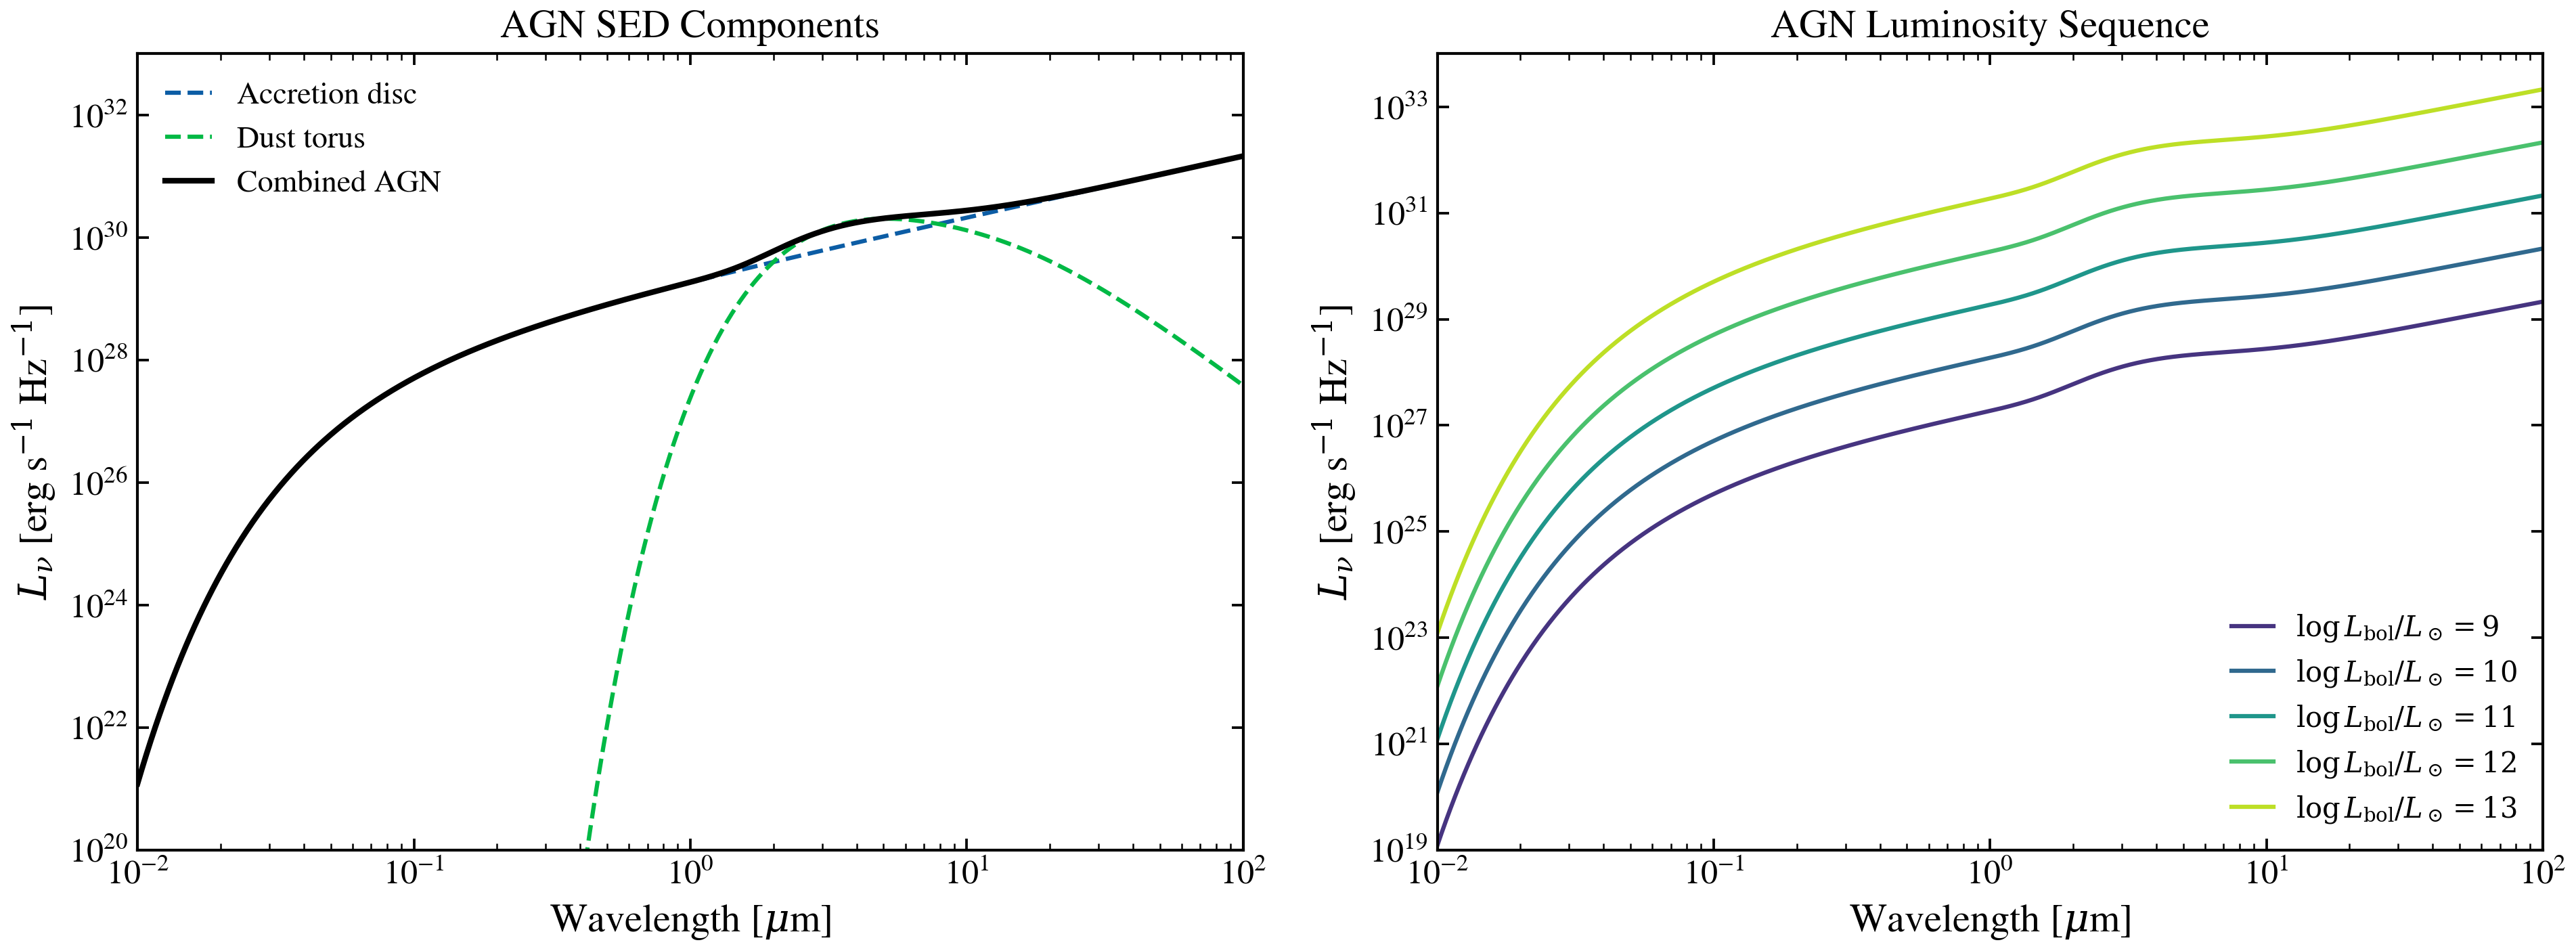
AGN SED Templates
Plot AGN spectral energy distributions showing the accretion disc and dust torus components at different bolometric luminosities.
import jax.numpy as jnp
import matplotlib.pyplot as plt
import numpy as np

from tengri.agn import powerlaw_disc, simple_torus
from tengri.analysis.plotting import setup_style

setup_style()

# Wavelength grid: 100 Angstrom to 100 micron
wavelength = jnp.logspace(np.log10(100), np.log10(1e6), 1000)
wave_um = np.array(wavelength) / 1e4  # convert to micron for plotting

# --- Figure 1: Component anatomy at fixed luminosity ---
disc = powerlaw_disc(wavelength, agn_log_lbol=11.0, agn_slope=-1.5)
torus = simple_torus(wavelength, agn_log_lbol=11.0, agn_torus_temp=1500.0)
combined = disc + 0.5 * torus

fig, axes = plt.subplots(1, 2, figsize=(13, 5))

# Left: component breakdown
ax = axes[0]
ax.loglog(wave_um, np.array(disc), "--", color="C0", lw=1.5, label="Accretion disc")
ax.loglog(wave_um, np.array(torus), "--", color="C1", lw=1.5, label="Dust torus")
ax.loglog(wave_um, np.array(combined), "k-", lw=2.0, label="Combined AGN")
ax.set_xlabel(r"Wavelength [$\mu$m]")
ax.set_ylabel(r"$L_\nu$ [erg s$^{-1}$ Hz$^{-1}$]")
ax.set_title("AGN SED Components")
ax.set_xlim(0.01, 100)
ax.set_ylim(1e20, 1e33)
ax.legend(frameon=False)

# Right: luminosity sequence
ax = axes[1]
# agn_log_lbol is log10(L_bol / L_sun); Seyfert→quasar range 10^9–10^13 Lsun
log_lbols = [9.0, 10.0, 11.0, 12.0, 13.0]
colors = plt.cm.viridis(np.linspace(0.15, 0.9, len(log_lbols)))

for log_lbol, color in zip(log_lbols, colors):
    disc_l = powerlaw_disc(wavelength, agn_log_lbol=log_lbol, agn_slope=-1.5)
    torus_l = simple_torus(wavelength, agn_log_lbol=log_lbol, agn_torus_temp=1500.0)
    total = disc_l + 0.5 * torus_l
    ax.loglog(
        wave_um,
        np.array(total),
        color=color,
        lw=1.5,
        label=rf"$\log L_{{\mathrm{{bol}}}}/L_\odot = {log_lbol:.0f}$",
    )

ax.set_xlabel(r"Wavelength [$\mu$m]")
ax.set_ylabel(r"$L_\nu$ [erg s$^{-1}$ Hz$^{-1}$]")
ax.set_title("AGN Luminosity Sequence")
ax.set_xlim(0.01, 100)
ax.set_ylim(1e19, 1e34)
ax.legend(frameon=False, fontsize=10)

fig.tight_layout()
plt.savefig("plot_agn_templates.png", dpi=150, bbox_inches="tight")
plt.show()