Note
Go to the end to download the full example code.
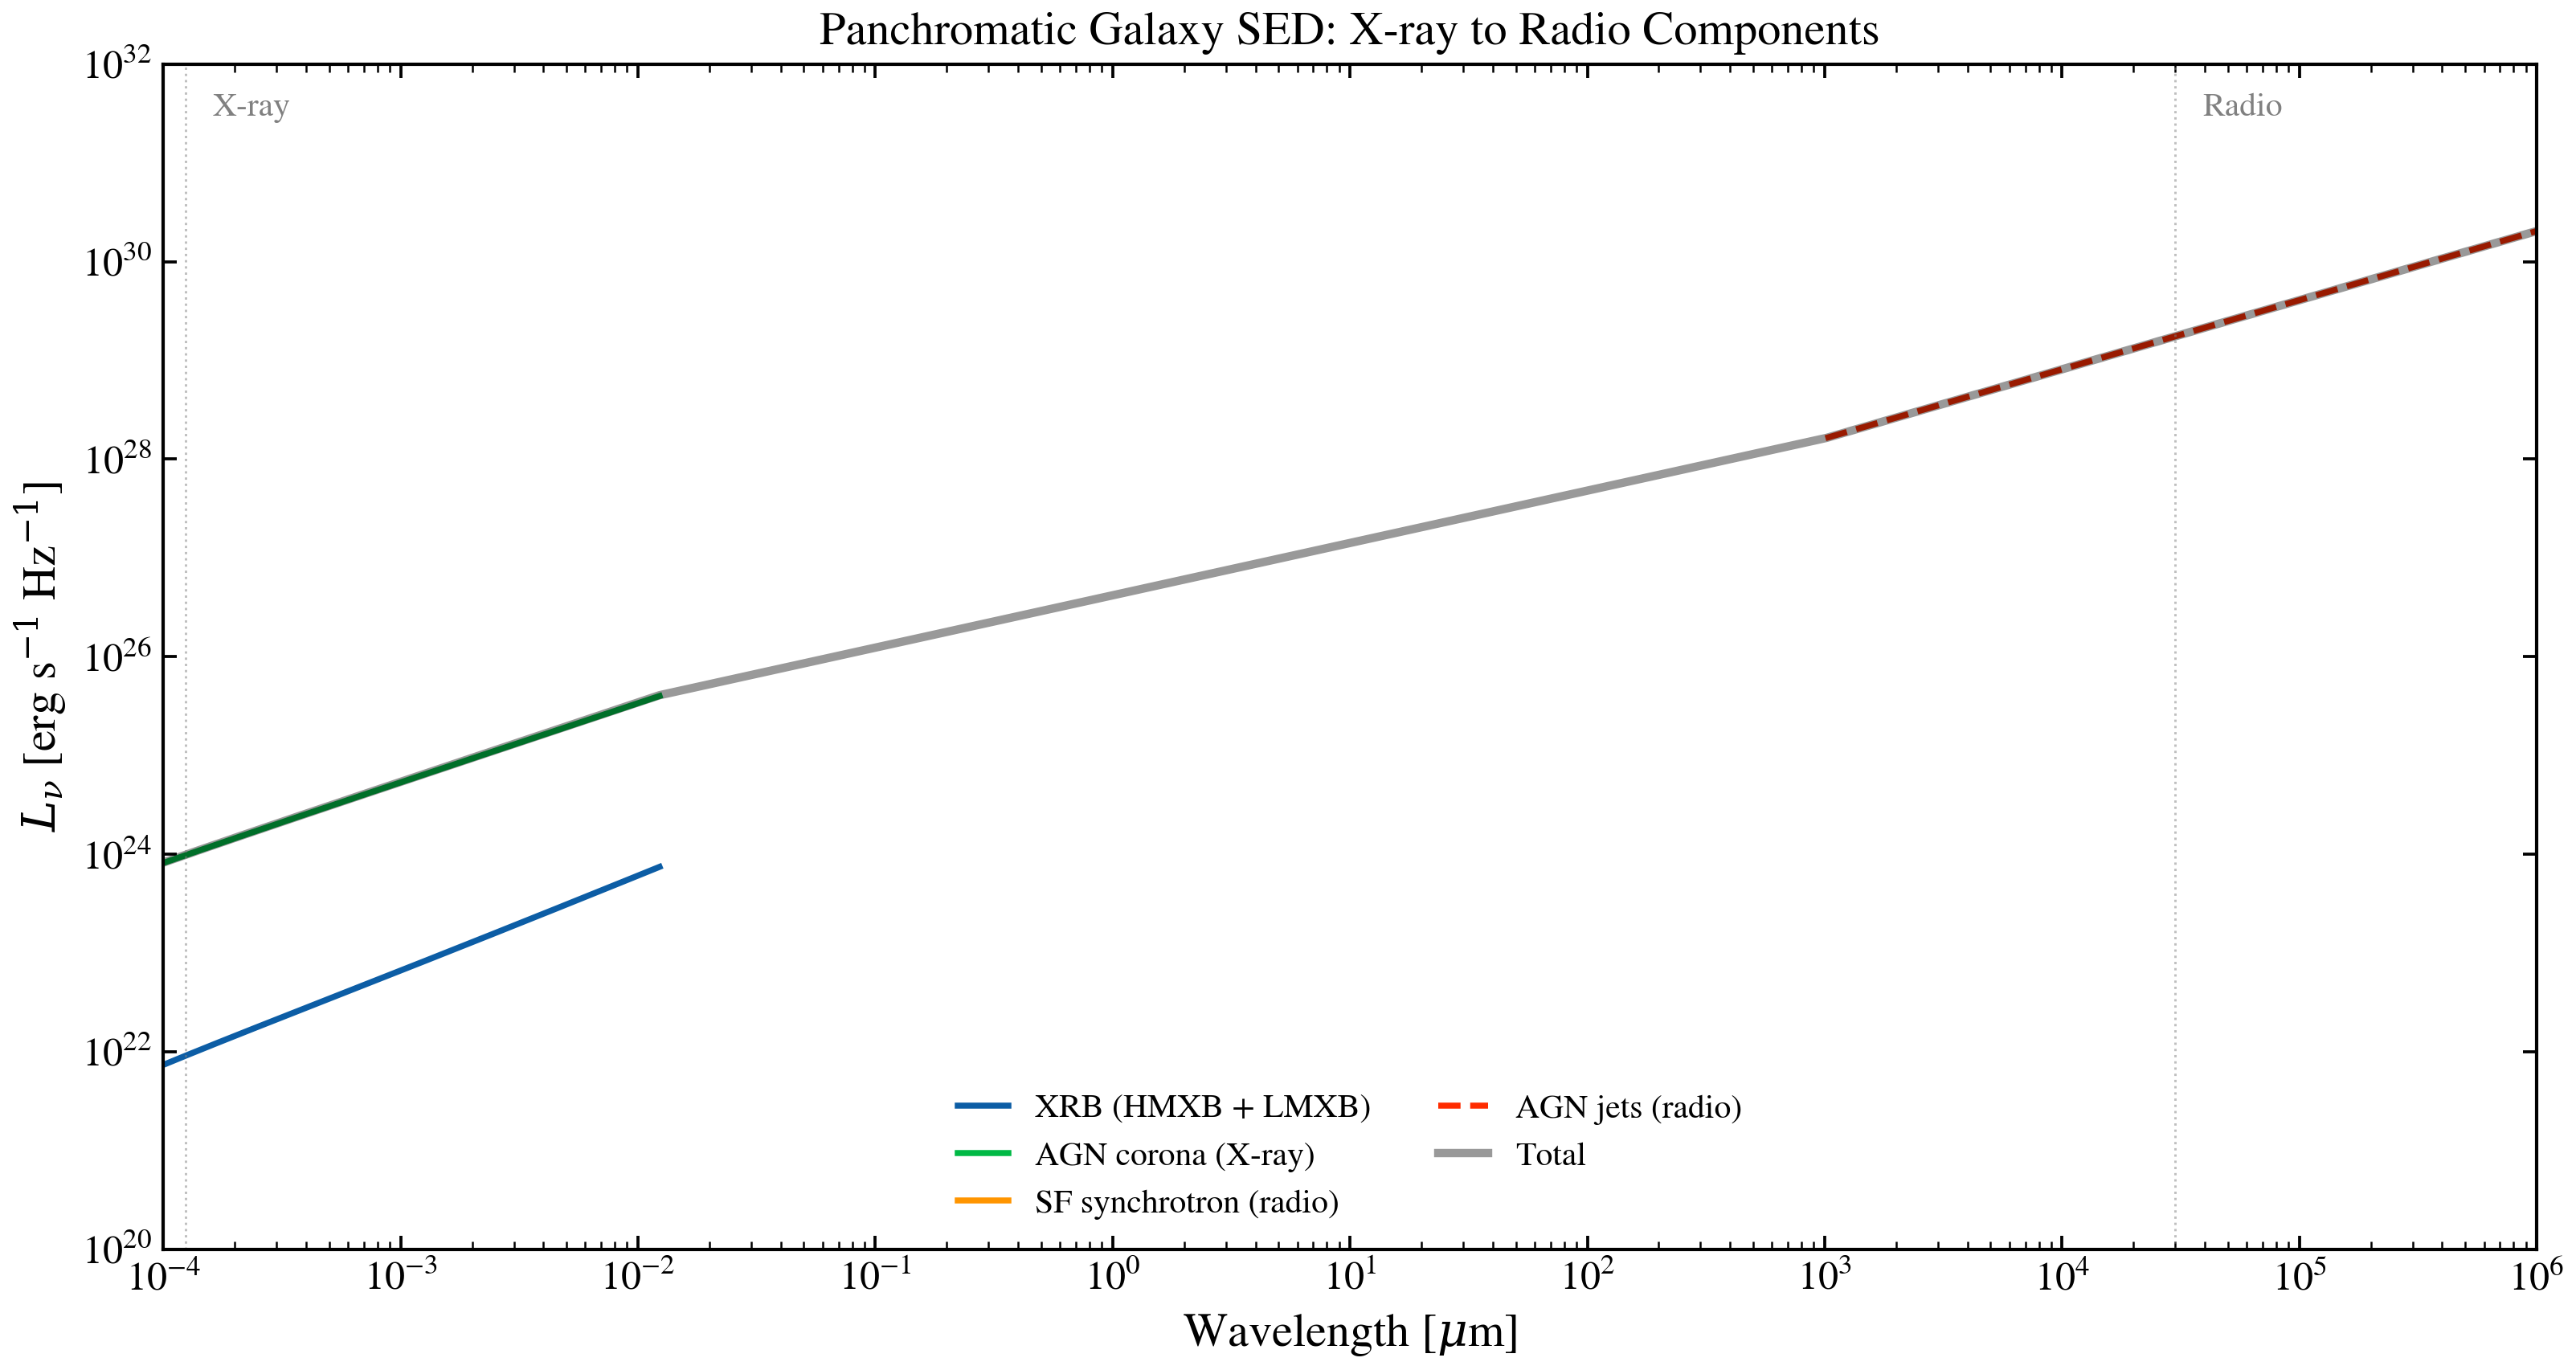
Panchromatic SED: UV to Radio
Build a full galaxy SED spanning X-ray to radio wavelengths. Shows stellar emission, dust attenuation, dust IR emission, radio synchrotron, and X-ray binary contributions. No SSP data required for the multi-wavelength components.
import jax.numpy as jnp
import matplotlib.pyplot as plt
import numpy as np

from tengri.analysis.plotting import setup_style
from tengri.radio import radio_agn, radio_star_forming
from tengri.xray import xray_agn_corona, xray_xrb

setup_style()
Wavelength grid: 1 Angstrom (hard X-ray) to 10^10 Angstrom (30 cm radio)
wavelength = jnp.logspace(0, 10, 2000)
wave_um = np.array(wavelength) / 1e4  # micron

# Galaxy parameters
SFR = 10.0  # Msun/yr
STELLAR_MASS = 1e11  # Msun
L_IR = 1e11  # Lsun (total IR 8-1000 um)
L_AGN_BOL = 1e44  # Lsun (AGN bolometric)
Compute each multi-wavelength component
# X-ray binaries: HMXB (SFR-scaled) + LMXB (mass-scaled)
l_xrb = xray_xrb(wavelength, sfr=SFR, stellar_mass=STELLAR_MASS)

# AGN X-ray corona
l_xray_agn = xray_agn_corona(wavelength, L_agn_bol=L_AGN_BOL)

# Radio synchrotron from star formation (FIR-radio correlation)
l_radio_sf = radio_star_forming(wavelength, L_ir=L_IR)

# Radio from AGN jets (moderate radio-loudness)
l_radio_agn = radio_agn(
    wavelength,
    L_agn_bol=L_AGN_BOL,
    radio_loudness=1.0,
)
Plot all components
fig, ax = plt.subplots(figsize=(11, 6))

components = [
    (l_xrb, "XRB (HMXB + LMXB)", "C0", "-"),
    (l_xray_agn, "AGN corona (X-ray)", "C1", "-"),
    (l_radio_sf, "SF synchrotron (radio)", "C2", "-"),
    (l_radio_agn, "AGN jets (radio)", "C3", "--"),
]

for l_nu, label, color, ls in components:
    l_np = np.array(l_nu)
    pos = l_np[l_np > 0]
    print(
        f"DIAG {label}: n_positive={len(pos)}, min={pos.min() if len(pos) else 0:.2e}, "
        f"max={l_np.max():.2e}"
    )
    # Mask zero-emission regions for clean plotting
    mask = l_np > 0
    if not np.any(mask):
        continue
    ax.loglog(wave_um[mask], l_np[mask], ls=ls, lw=1.8, color=color, label=label)

# Total envelope
l_total = np.array(l_xrb + l_xray_agn + l_radio_sf + l_radio_agn)
mask_total = l_total > 0
ax.loglog(
    wave_um[mask_total],
    l_total[mask_total],
    "k-",
    lw=2.5,
    alpha=0.4,
    label="Total",
)

ax.set_xlabel(r"Wavelength [$\mu$m]")
ax.set_ylabel(r"$L_\nu$ [erg s$^{-1}$ Hz$^{-1}$]")
ax.set_title("Panchromatic Galaxy SED: X-ray to Radio Components")
ax.set_xlim(1e-4, 1e6)
ax.set_ylim(1e20, 1e32)
ax.legend(frameon=False, fontsize=10, ncol=2)

# Annotate wavelength regime boundaries
for x, label in [(1.24e-4, "X-ray"), (3e4, "Radio")]:
    ax.axvline(x, color="grey", ls=":", lw=0.7, alpha=0.5)
    ax.text(x * 1.3, ax.get_ylim()[1] * 0.3, label, fontsize=10, color="grey")

fig.tight_layout()
plt.savefig("plot_radio_xray.png", dpi=150, bbox_inches="tight")
plt.show()