Note
Go to the end to download the full example code.
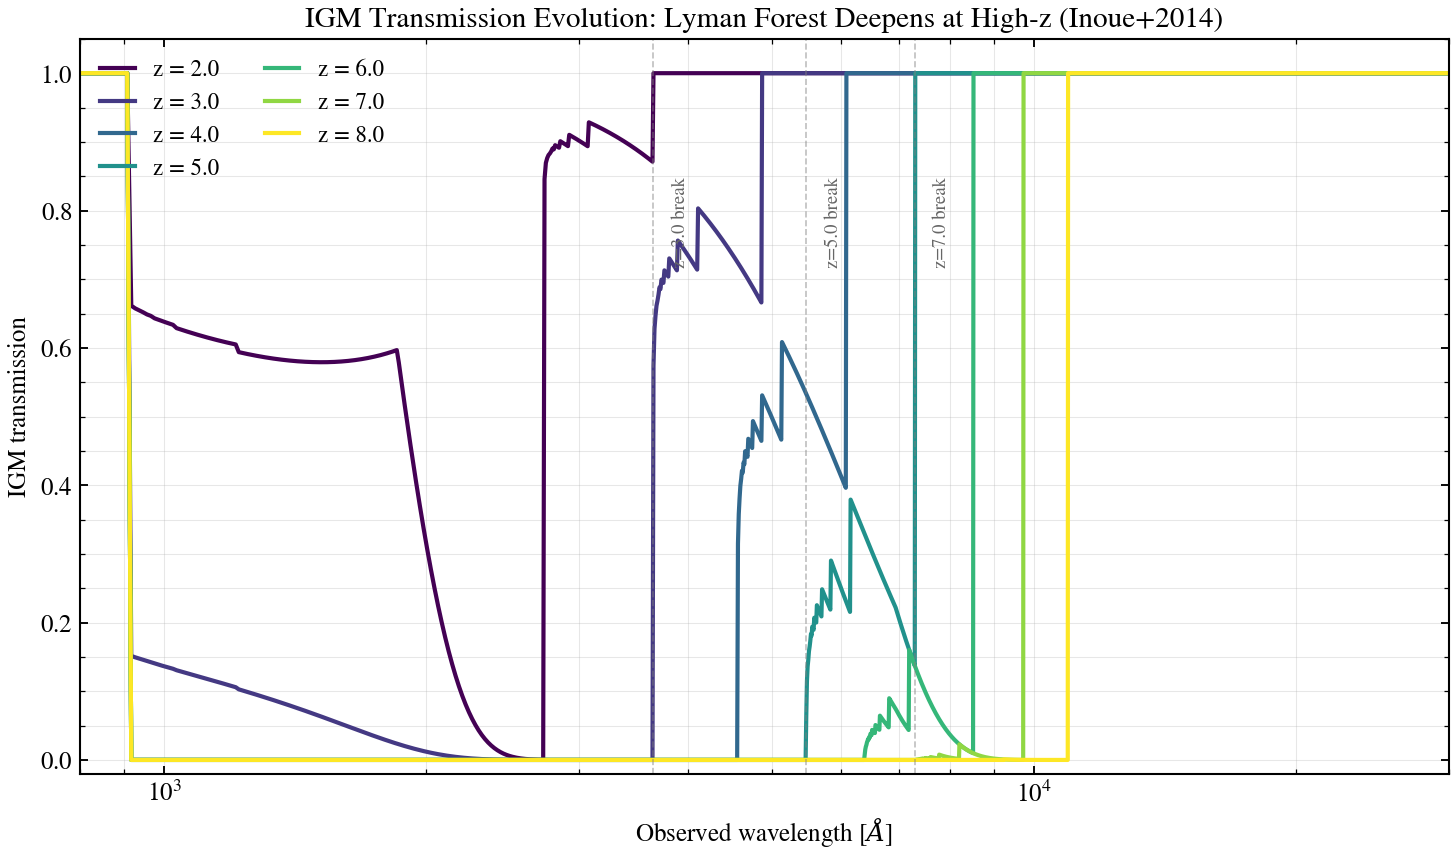
IGM Absorption Evolution with Redshift
The intergalactic medium (IGM) opacity increases dramatically with redshift due to the expanding neutral hydrogen fraction. This script sweeps redshift z ∈ {2, 3, 4, 5, 6, 7, 8} on Inoue+2014 IGM transmission curves, showing how the Lyman alpha forest deepens and the Lyman break (912 Å rest-frame) sharpens at higher z, affecting photometric redshift estimation via dropout techniques.
from pathlib import Path

import jax
import jax.numpy as jnp
import matplotlib

matplotlib.use("Agg")
import matplotlib.pyplot as plt
import numpy as np

jax.config.update("jax_enable_x64", True)

from tengri.analysis.plotting import SWEEP_CMAPS, setup_style
from tengri.igm import igm_transmission

setup_style()

# Observed-frame wavelength grid covering UV to optical
wave_obs = jnp.linspace(800.0, 30000.0, 3000)

redshifts = [2.0, 3.0, 4.0, 5.0, 6.0, 7.0, 8.0]
cmap = plt.get_cmap(SWEEP_CMAPS["redshift"])
colors = [cmap(i / max(len(redshifts) - 1, 1)) for i in range(len(redshifts))]

fig, ax = plt.subplots(figsize=(10, 6))

# Plot transmission curves
for z, color in zip(redshifts, colors):
    trans = igm_transmission(wave_obs, z)
    ax.plot(
        np.array(wave_obs),
        np.array(trans),
        color=color,
        lw=2.0,
        label=f"z = {z}",
    )

# Mark Lyman break at 912 Å rest-frame for key redshifts
# The break moves to longer observed wavelengths as z increases
for z in [3.0, 5.0, 7.0]:
    lyman_break_obs = 912.0 * (1 + z)
    ax.axvline(lyman_break_obs, color="0.5", lw=0.8, ls="--", alpha=0.5)
    ax.text(
        lyman_break_obs * 1.05,
        0.85,
        f"z={z} break",
        fontsize=9,
        color="0.4",
        rotation=90,
        va="top",
    )

ax.set_xlabel(r"Observed wavelength [$\AA$]", fontsize=12)
ax.set_ylabel("IGM transmission", fontsize=12)
ax.set_xlim(800, 30000)
ax.set_xscale("log")
ax.set_ylim(-0.02, 1.05)
ax.legend(fontsize=11, frameon=False, ncol=2, loc="upper left")
ax.set_title(
    "IGM Transmission Evolution: Lyman Forest Deepens at High-z (Inoue+2014)",
    fontsize=14,
)
ax.grid(True, alpha=0.3, which="both")

fig.tight_layout()
# Save to script directory
script_dir = Path(__file__).resolve().parent if "__file__" in dir() else Path(".")
plt.savefig(str(script_dir / "plot_igm_z_evolution.png"), dpi=150, bbox_inches="tight")
plt.close()