Note
Go to the end to download the full example code.
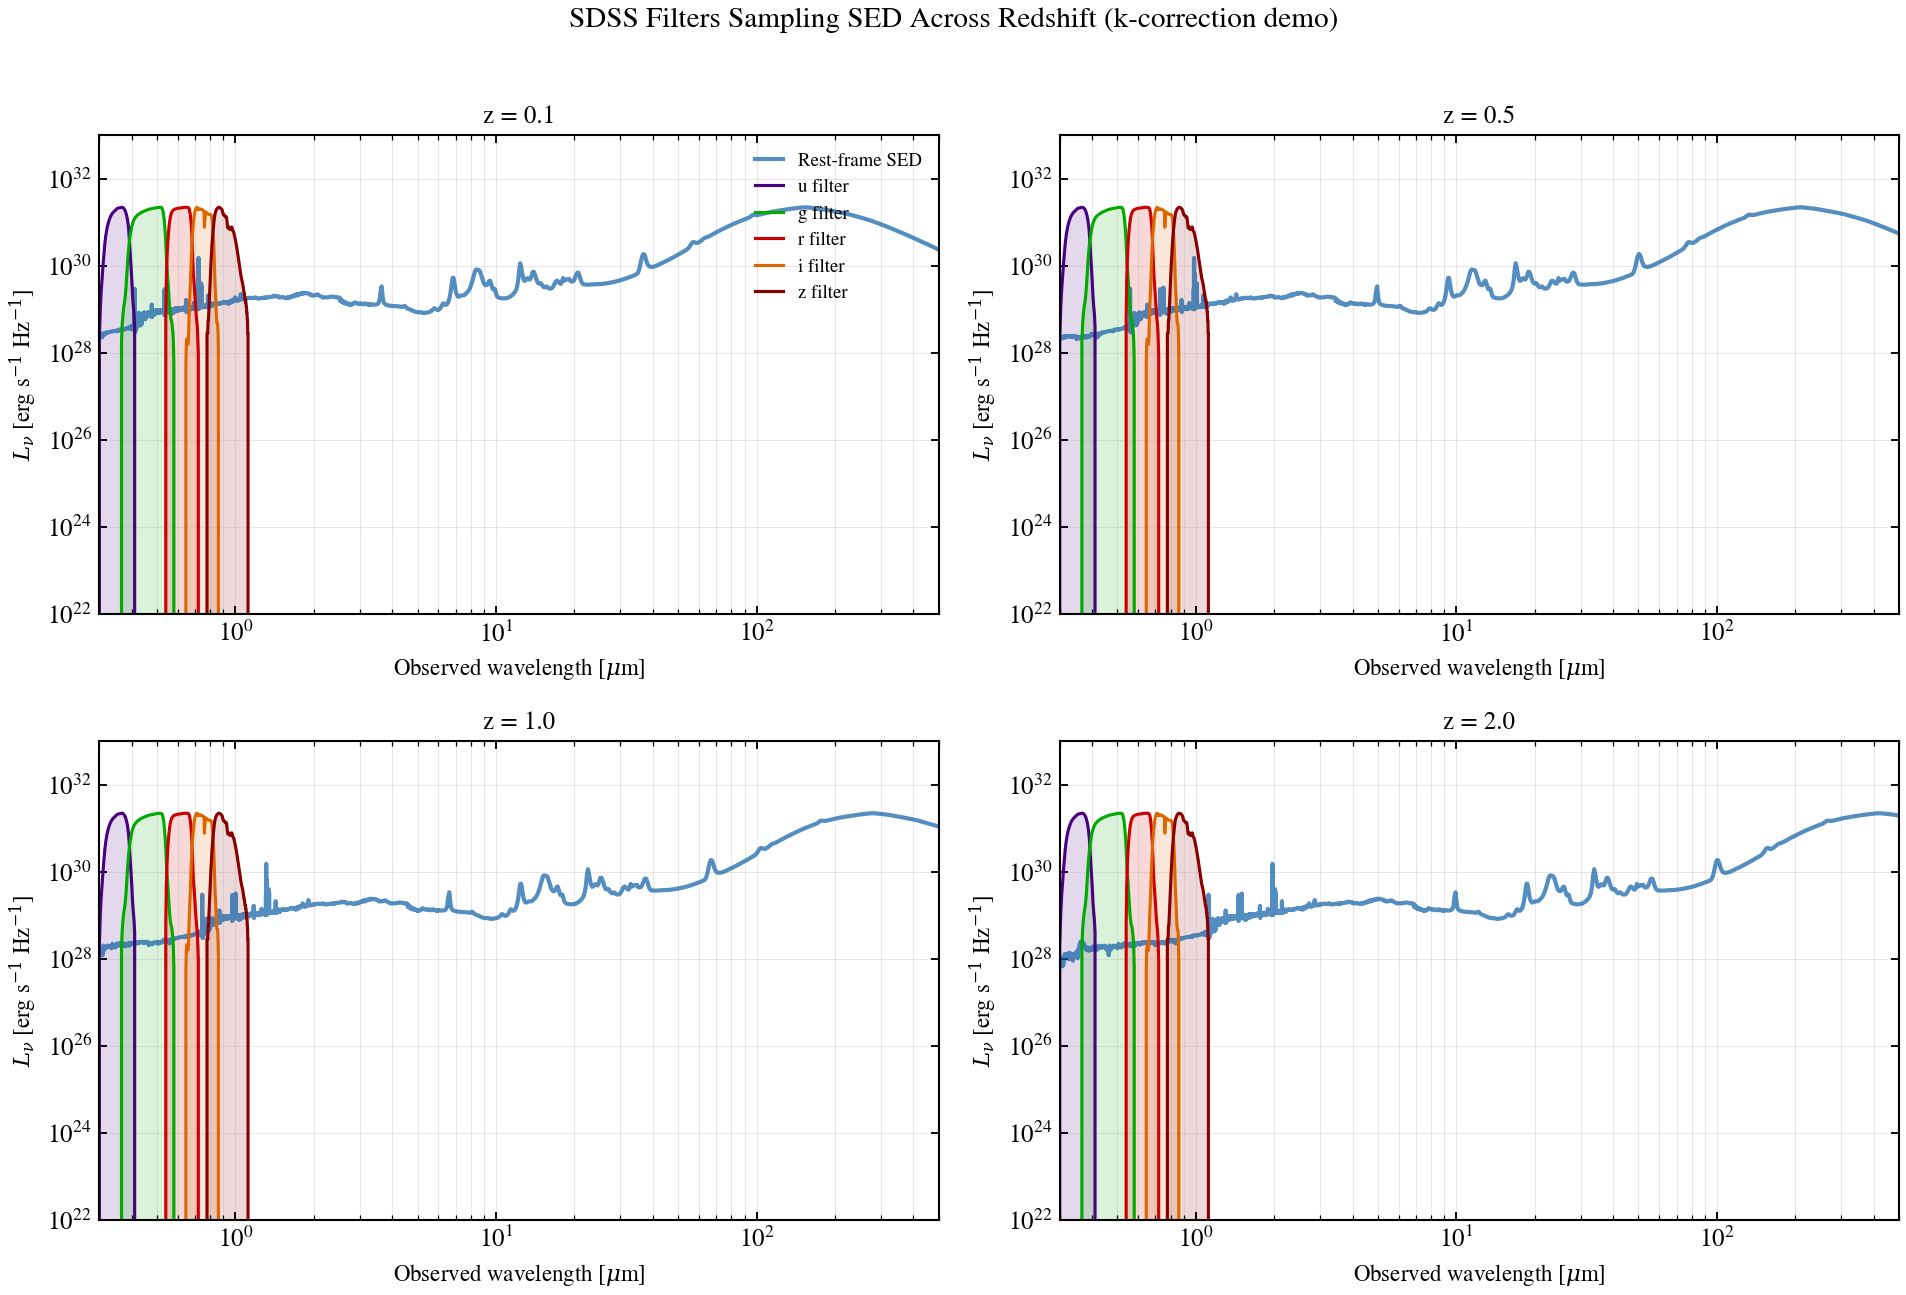
Filter Sampling Across Redshift
Rest-frame stellar continuum overlaid with redshifted SDSS ugriz transmission curves at z ∈ {0.1, 0.5, 1.0, 2.0}. The plot shows which features each band actually samples as a galaxy moves out — the textbook source of k-correction sign.
from pathlib import Path

import jax
import jax.numpy as jnp
import matplotlib

matplotlib.use("Agg")
import matplotlib.pyplot as plt
import numpy as np

jax.config.update("jax_enable_x64", True)

from tengri import (
    Fixed,
    Observation,
    Parameters,
    SEDModel,
    Spectroscopy,
    load_filter_set,
    load_ssp_data,
    setup_style,
)

setup_style()


def _find_ssp():
    """Find SSP data file in standard locations."""
    name = "ssp_prsc_miles_chabrier_wNE_logGasU-3.0_logGasZ0.0.h5"
    for p in [
        Path("data") / name,
        Path("../data") / name,
        Path("../../data") / name,
        Path("../../../data") / name,
    ]:
        if p.exists():
            return str(p)
    return None


def _find_filters():
    """Find filter cache directory in standard locations."""
    for p in [
        Path("data/filters"),
        Path("../data/filters"),
        Path("../../data/filters"),
        Path("../../../data/filters"),
    ]:
        if p.exists():
            return str(p)
    return "data/filters"


ssp_path = _find_ssp()
if ssp_path is None:
    raise FileNotFoundError("SSP data not found — skipping example")

filter_dir = _find_filters()

ssp = load_ssp_data(ssp_path)

# Generate a template star-forming galaxy SED (rest-frame)
wave_rest = jnp.logspace(jnp.log10(1000.0), jnp.log10(3e5), 500)  # 0.1 µm – 30 µm [Å]
obs_dummy = Observation(spectroscopy=Spectroscopy(wave_obs=wave_rest))

spec = Parameters(
    mean_sfh_type="tsnorm",
    dust_emission="draine_li2007",
    sfh_tsnorm_log_peak_sfr=Fixed(1.0),
    sfh_tsnorm_peak_lbt_gyr=Fixed(2.0),
    sfh_tsnorm_width_gyr=Fixed(1.5),
    sfh_tsnorm_skew=Fixed(0.0),
    sfh_tsnorm_trunc=Fixed(2.0),
    met_logzsol=Fixed(0.0),
    dust_tau_bc=Fixed(0.3),
    dust_tau_diff=Fixed(0.2),
    dust_slope=Fixed(-0.7),
    dust_umin=Fixed(2.0),
    dust_qpah=Fixed(3.5),
    dust_gamma_dl=Fixed(0.02),
    redshift=Fixed(0.0),  # Rest-frame for now
)

model = SEDModel(spec, ssp, observation=obs_dummy)
key = jax.random.PRNGKey(42)
params = spec.sample(key)
pred = model.predict_rest_sed(params)

wave_rest_um = np.array(pred.wavelength) / 1e4
sed_rest = np.array(pred.sed)

# Load SDSS filters
filter_names = ["sdss_u", "sdss_g", "sdss_r", "sdss_i", "sdss_z"]
_, _, filter_curves = load_filter_set(filter_names, cache_dir=filter_dir)

band_colors = {
    "sdss_u": "#4B0082",
    "sdss_g": "#00AA00",
    "sdss_r": "#CC0000",
    "sdss_i": "#DD6600",
    "sdss_z": "#880000",
}

# Redshifts to visualize
redshifts = [0.1, 0.5, 1.0, 2.0]

fig, axes = plt.subplots(2, 2, figsize=(13, 9))
axes = axes.flatten()

for i, z in enumerate(redshifts):
    ax = axes[i]

    # Plot rest-frame SED (shifted to observed frame)
    wave_obs_um = wave_rest_um * (1 + z)
    ax.loglog(
        wave_obs_um,
        sed_rest,
        color="C0",
        lw=2.0,
        label="Rest-frame SED",
        alpha=0.7,
    )

    # Overlay redshifted filters
    for fc, fname in zip(filter_curves, filter_names):
        wave_filter = np.array(fc.wave) / 1e4  # Å → µm
        trans = np.array(fc.trans)

        # Normalize transmission to fit on log plot
        trans_scaled = trans * np.max(sed_rest) / np.max(trans)

        color = band_colors[fname]
        band_short = fname.replace("sdss_", "")
        ax.fill_between(wave_filter, 1e20, trans_scaled, alpha=0.15, color=color)
        ax.plot(wave_filter, trans_scaled, color=color, lw=1.5, label=f"{band_short} filter")

    ax.set_xlim(0.3, 5e2)
    ax.set_ylim(1e22, 1e33)
    ax.set_xlabel(r"Observed wavelength [$\mu$m]", fontsize=11)
    ax.set_ylabel(r"$L_\nu$ [erg s$^{-1}$ Hz$^{-1}$]", fontsize=11)
    ax.set_title(f"z = {z}", fontsize=12)
    if i == 0:
        ax.legend(fontsize=9, frameon=False, loc="upper right")
    ax.grid(True, alpha=0.3, which="both")

fig.suptitle("SDSS Filters Sampling SED Across Redshift (k-correction demo)", fontsize=14)
fig.tight_layout(rect=[0, 0.01, 1, 0.97])
# Save to script directory
script_dir = Path(__file__).resolve().parent if "__file__" in dir() else Path(".")
plt.savefig(str(script_dir / "plot_redshift_filter_grid.png"), dpi=150, bbox_inches="tight")
plt.close()