Note
Go to the end to download the full example code.
FIR-radio correlation: q_IR sets radio loudness
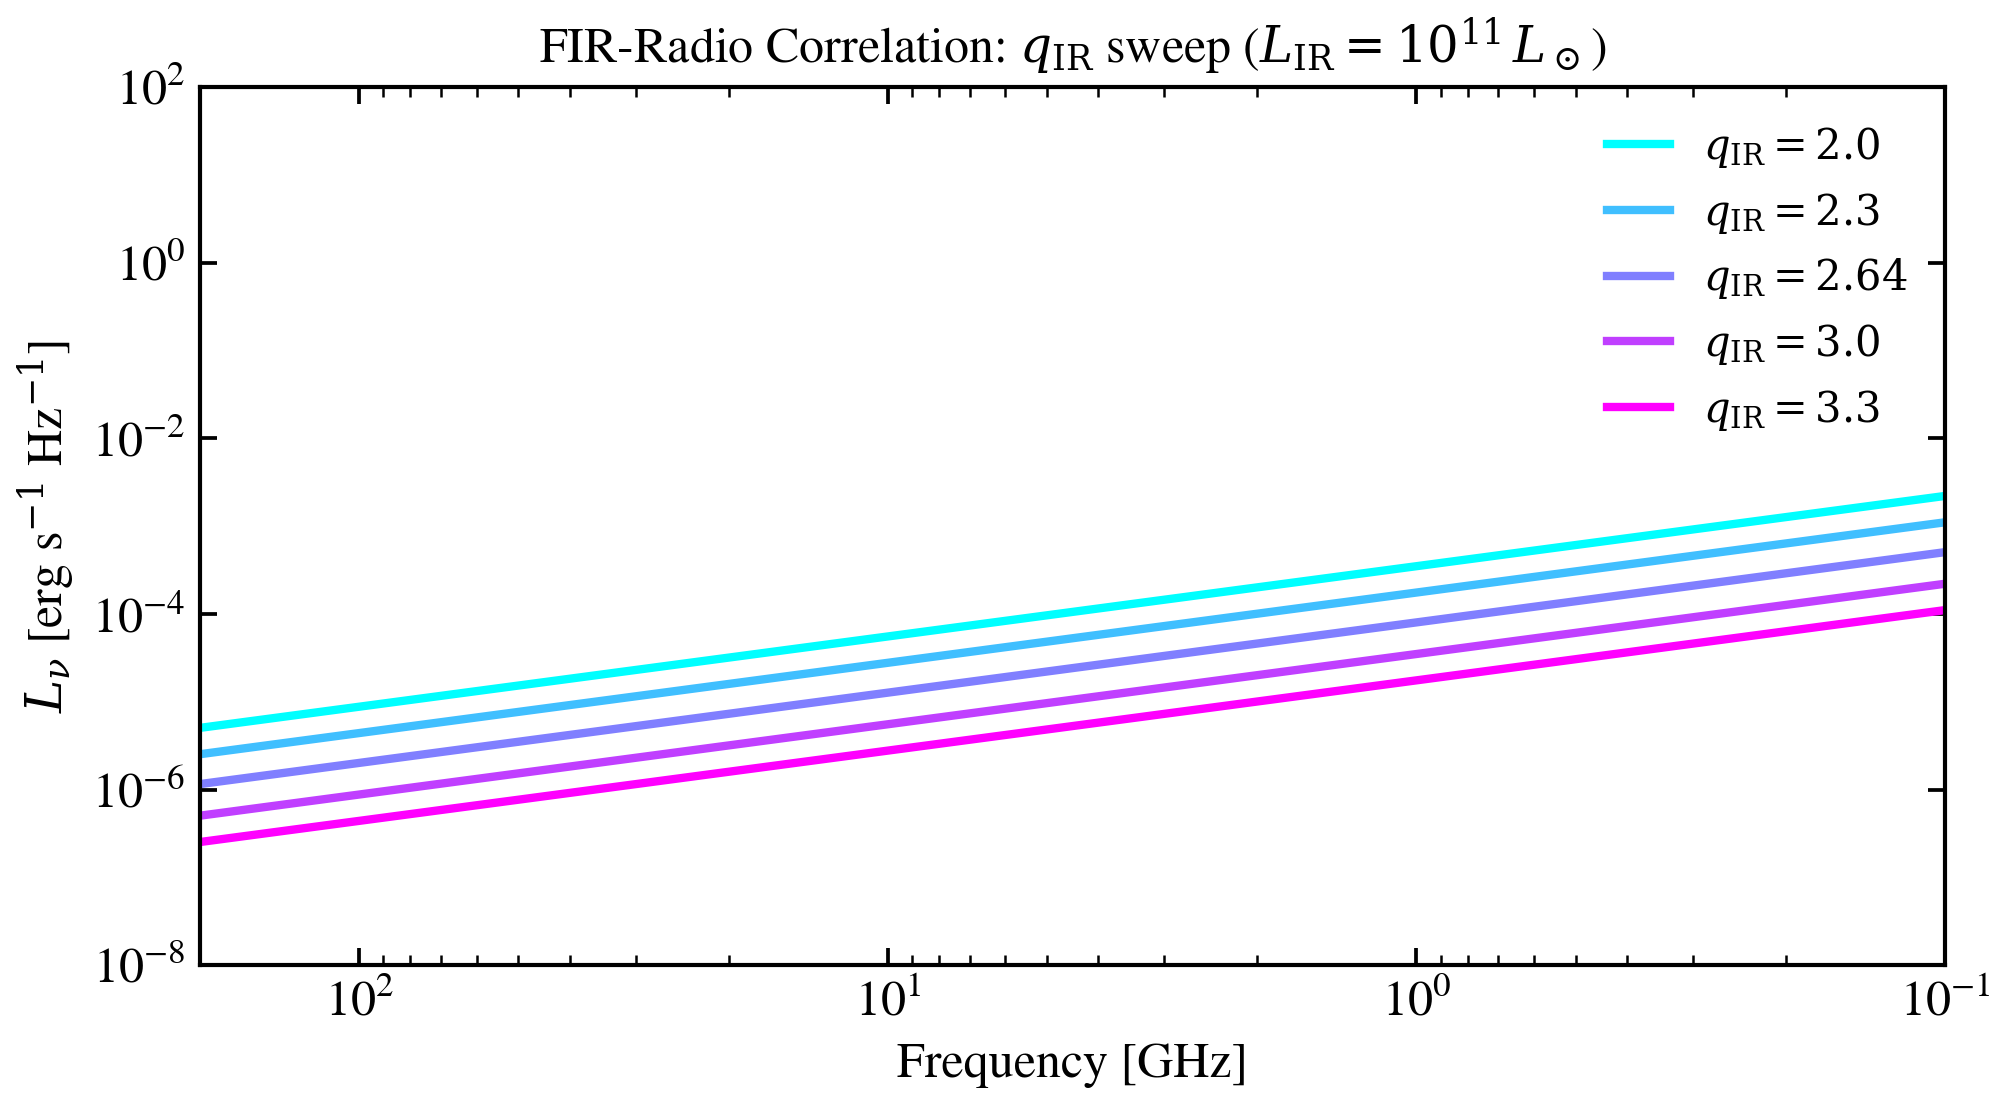
The dimensionless parameter q_IR characterizes the FIR-radio correlation, linking far-infrared luminosity to 1.4 GHz synchrotron emission. Higher q_IR means relatively weaker radio per unit star formation. We vary q_IR across the observationally motivated range 2.0–3.3 at fixed L_IR = 10^11 L_sun, demonstrating how radio loudness evolves (Bell 2003).
Reference: Bell 2003, ApJ 586, 794.
import os

os.environ["TF_CPP_MIN_LOG_LEVEL"] = "2"  # suppress XLA/PjRt C++ INFO+WARNING logs

import warnings

import jax.numpy as jnp
import matplotlib as mpl
import matplotlib.pyplot as plt
import numpy as np

from tengri.plot import setup_style

setup_style()
warnings.filterwarnings("ignore", message=".*BakedInBackend.*")

from tengri.radio import radio_star_forming

wave = jnp.logspace(7, 11, 600)  # Angstrom: 1 mm = 1e7 Å, 10 m = 1e11 Å
L_ir = 1e11  # L_sun — ULIRG-like

q_ir_values = np.array([2.0, 2.3, 2.64, 3.0, 3.3])
norm = mpl.colors.Normalize(vmin=q_ir_values.min(), vmax=q_ir_values.max())
cmap = plt.get_cmap("viridis")

fig, ax = plt.subplots(figsize=(6.5, 4.2))
for q_ir in q_ir_values:
    L_nu = radio_star_forming(wave, L_ir=L_ir, q_ir=q_ir, alpha_sf=0.8)
    nu_ghz = (3e18 / np.array(wave)) / 1e9  # convert Å → Hz → GHz
    ax.loglog(nu_ghz, np.array(L_nu), color=cmap(norm(q_ir)), lw=1.4)

ax.set_xlabel(r"Frequency $\nu$ [GHz]")
ax.set_ylabel(r"$L_\nu$ [erg s$^{-1}$ Hz$^{-1}$]")
ax.invert_xaxis()
ax.set_xlim(200, 0.1)
ax.set_ylim(1e-8, 1e2)

cbar = fig.colorbar(plt.cm.ScalarMappable(norm=norm, cmap=cmap), ax=ax, pad=0.01)
cbar.set_label(r"q$_{\rm IR}$")

fig.tight_layout()
plt.savefig("plot_q_ir_sweep.png", dpi=150, bbox_inches="tight")