Note
Go to the end to download the full example code.
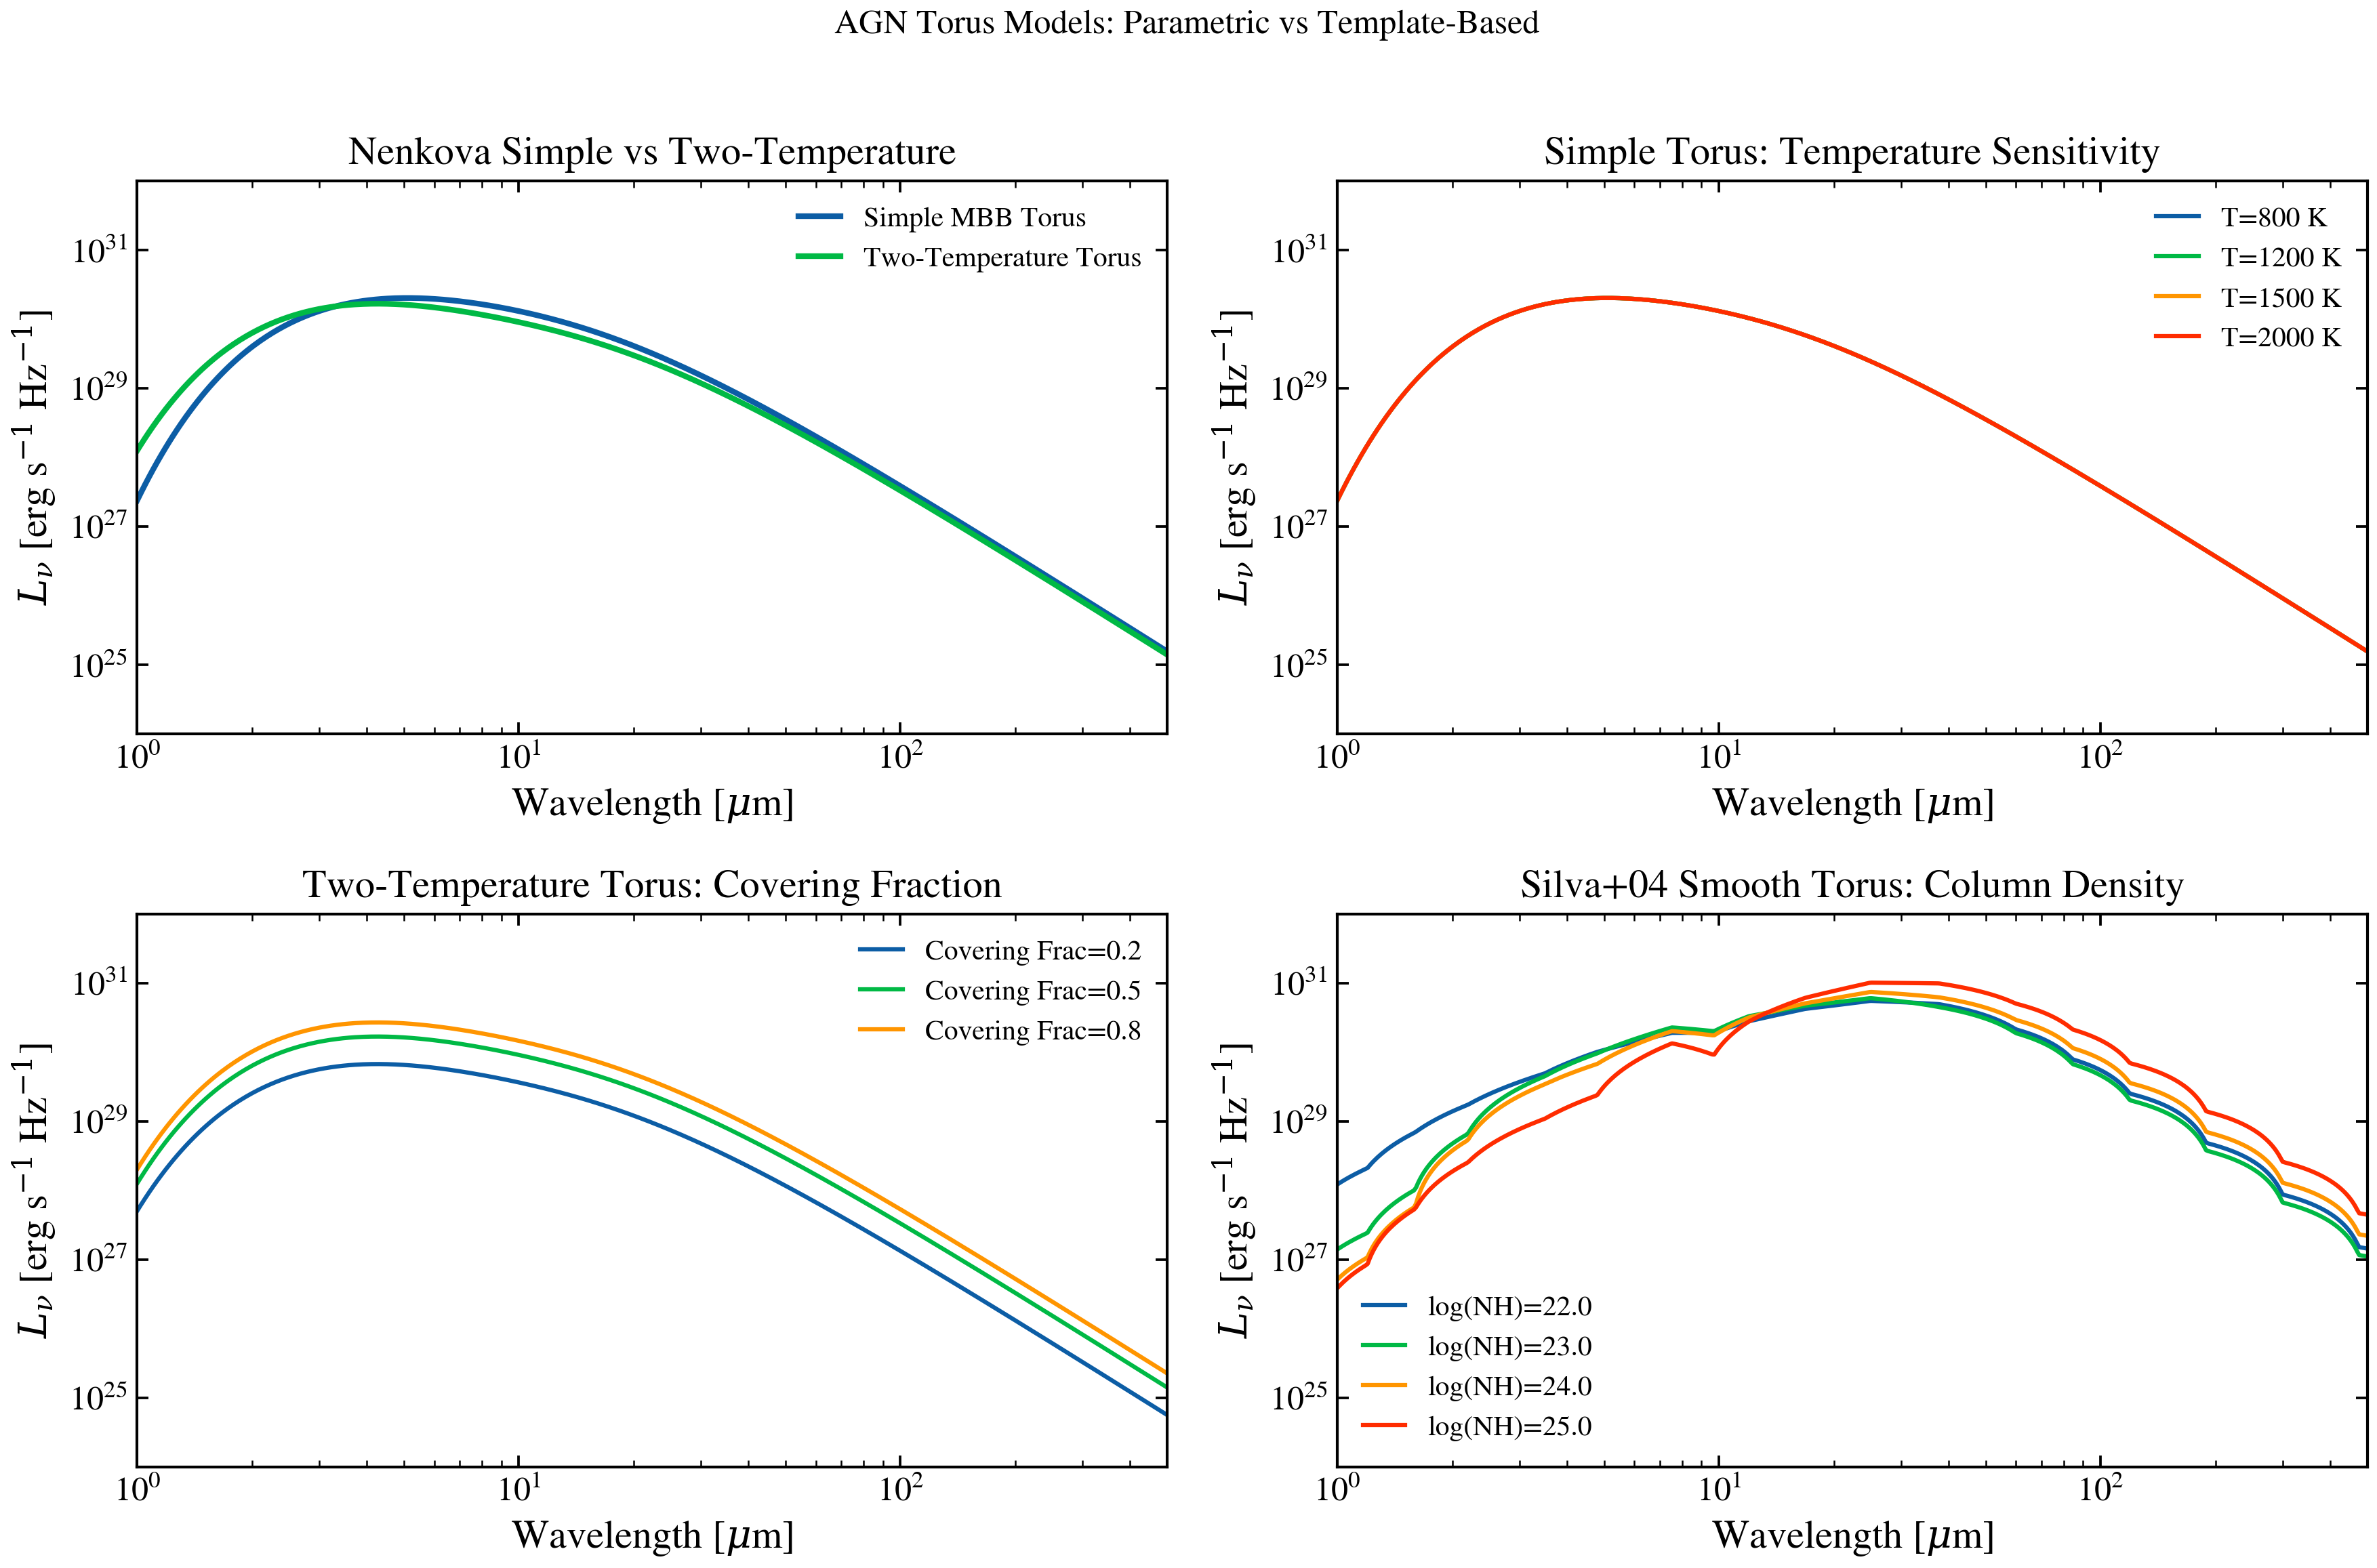
Torus Models Comparison: Nenkova vs Silva04
Compare torus models spanning simple parametric (two-temperature MBB), smooth-torus (Silva+04), and test the effects of covering factor and optical depth on the infrared SED.
from pathlib import Path

import jax.numpy as jnp
import matplotlib.pyplot as plt
import numpy as np

# Wavelength grid: 1 - 500 micron (IR torus)
wavelength = jnp.logspace(np.log10(1e4), np.log10(5e6), 512)
wave_um = np.array(wavelength) / 1e4

from tengri.analysis.plotting import setup_style
from tengri.components.agn import simple_torus, two_temperature_torus

setup_style()

fig, axes = plt.subplots(2, 2, figsize=(12, 8))

# --- Panel 1: Simple vs Two-Temperature Torus (Nenkova) ---
ax = axes[0, 0]

lbol = 11.0  # log10(L_bol / L_sun); ~10^44.5 erg/s (Seyfert/QSO)
for torus_model, label, color in [
    ("simple", "Simple MBB Torus", "C0"),
    ("two_temp", "Two-Temperature Torus", "C1"),
]:
    if torus_model == "simple":
        sed = simple_torus(wavelength, agn_log_lbol=lbol, agn_torus_temp=1500.0)
    else:
        sed = two_temperature_torus(wavelength, agn_log_lbol=lbol, agn_torus_frac=0.5)

    ax.loglog(wave_um, np.array(sed), lw=2.0, label=label, color=color)

ax.set_xlabel(r"Wavelength [$\mu$m]")
ax.set_ylabel(r"$L_\nu$ [erg s$^{-1}$ Hz$^{-1}$]")
ax.set_title("Nenkova Simple vs Two-Temperature")
ax.legend(fontsize=10, frameon=False)
ax.set_xlim(1, 500)
ax.set_ylim(1e24, 1e32)

# --- Panel 2: Temperature sweep (Simple MBB) ---
ax = axes[0, 1]

for temp in [800.0, 1200.0, 1500.0, 2000.0]:
    sed = simple_torus(wavelength, agn_log_lbol=11.0, agn_torus_temp=temp)
    ax.loglog(wave_um, np.array(sed), lw=1.5, label=f"T={temp:.0f} K")

ax.set_xlabel(r"Wavelength [$\mu$m]")
ax.set_ylabel(r"$L_\nu$ [erg s$^{-1}$ Hz$^{-1}$]")
ax.set_title("Simple Torus: Temperature Sensitivity")
ax.legend(fontsize=10, frameon=False)
ax.set_xlim(1, 500)
ax.set_ylim(1e24, 1e32)

# --- Panel 3: Covering fraction sweep ---
ax = axes[1, 0]

for frac in [0.2, 0.5, 0.8]:
    sed = two_temperature_torus(wavelength, agn_log_lbol=11.0, agn_torus_frac=frac)
    ax.loglog(wave_um, np.array(sed), lw=1.5, label=f"Covering Frac={frac:.1f}")

ax.set_xlabel(r"Wavelength [$\mu$m]")
ax.set_ylabel(r"$L_\nu$ [erg s$^{-1}$ Hz$^{-1}$]")
ax.set_title("Two-Temperature Torus: Covering Fraction")
ax.legend(fontsize=10, frameon=False)
ax.set_xlim(1, 500)
ax.set_ylim(1e24, 1e32)

# --- Panel 4: Silva04 (if available) ---
ax = axes[1, 1]

_silva04_path = None
for p in [
    Path("data/silva04_torus_grid.h5"),
    Path("../data/silva04_torus_grid.h5"),
    Path("../../data/silva04_torus_grid.h5"),
]:
    if p.exists():
        _silva04_path = str(p)
        break

if _silva04_path is not None:
    from tengri.components.agn import create_silva04_from_grid

    silva04_fn = create_silva04_from_grid(_silva04_path)

    # Silva04 varies column density (NH)
    for log_nh in [22.0, 23.0, 24.0, 25.0]:
        sed = silva04_fn(wavelength, agn_log_lbol=11.0, agn_log_nh_silva=log_nh)
        ax.loglog(wave_um, np.array(sed), lw=1.5, label=f"log(NH)={log_nh:.1f}")

    ax.set_xlabel(r"Wavelength [$\mu$m]")
    ax.set_ylabel(r"$L_\nu$ [erg s$^{-1}$ Hz$^{-1}$]")
    ax.set_title("Silva+04 Smooth Torus: Column Density")
    ax.legend(fontsize=10, frameon=False)
    ax.set_xlim(1, 500)
    ax.set_ylim(1e24, 1e32)
else:
    # If Silva04 not available, show nenkova comparison
    sed1 = simple_torus(wavelength, agn_log_lbol=10.0, agn_torus_temp=1500.0)
    sed2 = simple_torus(wavelength, agn_log_lbol=11.0, agn_torus_temp=1500.0)
    sed3 = simple_torus(wavelength, agn_log_lbol=12.0, agn_torus_temp=1500.0)

    ax.loglog(wave_um, np.array(sed1), lw=1.5, label="log(L_bol)=43")
    ax.loglog(wave_um, np.array(sed2), lw=1.5, label="log(L_bol)=44")
    ax.loglog(wave_um, np.array(sed3), lw=1.5, label="log(L_bol)=45")

    ax.set_xlabel(r"Wavelength [$\mu$m]")
    ax.set_ylabel(r"$L_\nu$ [erg s$^{-1}$ Hz$^{-1}$]")
    ax.set_title("Torus Luminosity Dependence")
    ax.legend(fontsize=10, frameon=False)
    ax.set_xlim(1, 500)
    ax.set_ylim(1e24, 1e32)

fig.suptitle("AGN Torus Models: Parametric vs Template-Based", fontsize=12)
fig.tight_layout(rect=[0, 0, 1, 0.97])
plt.savefig("plot_torus_comparison.png", dpi=100, bbox_inches="tight")
plt.show()