Note
Go to the end to download the full example code.
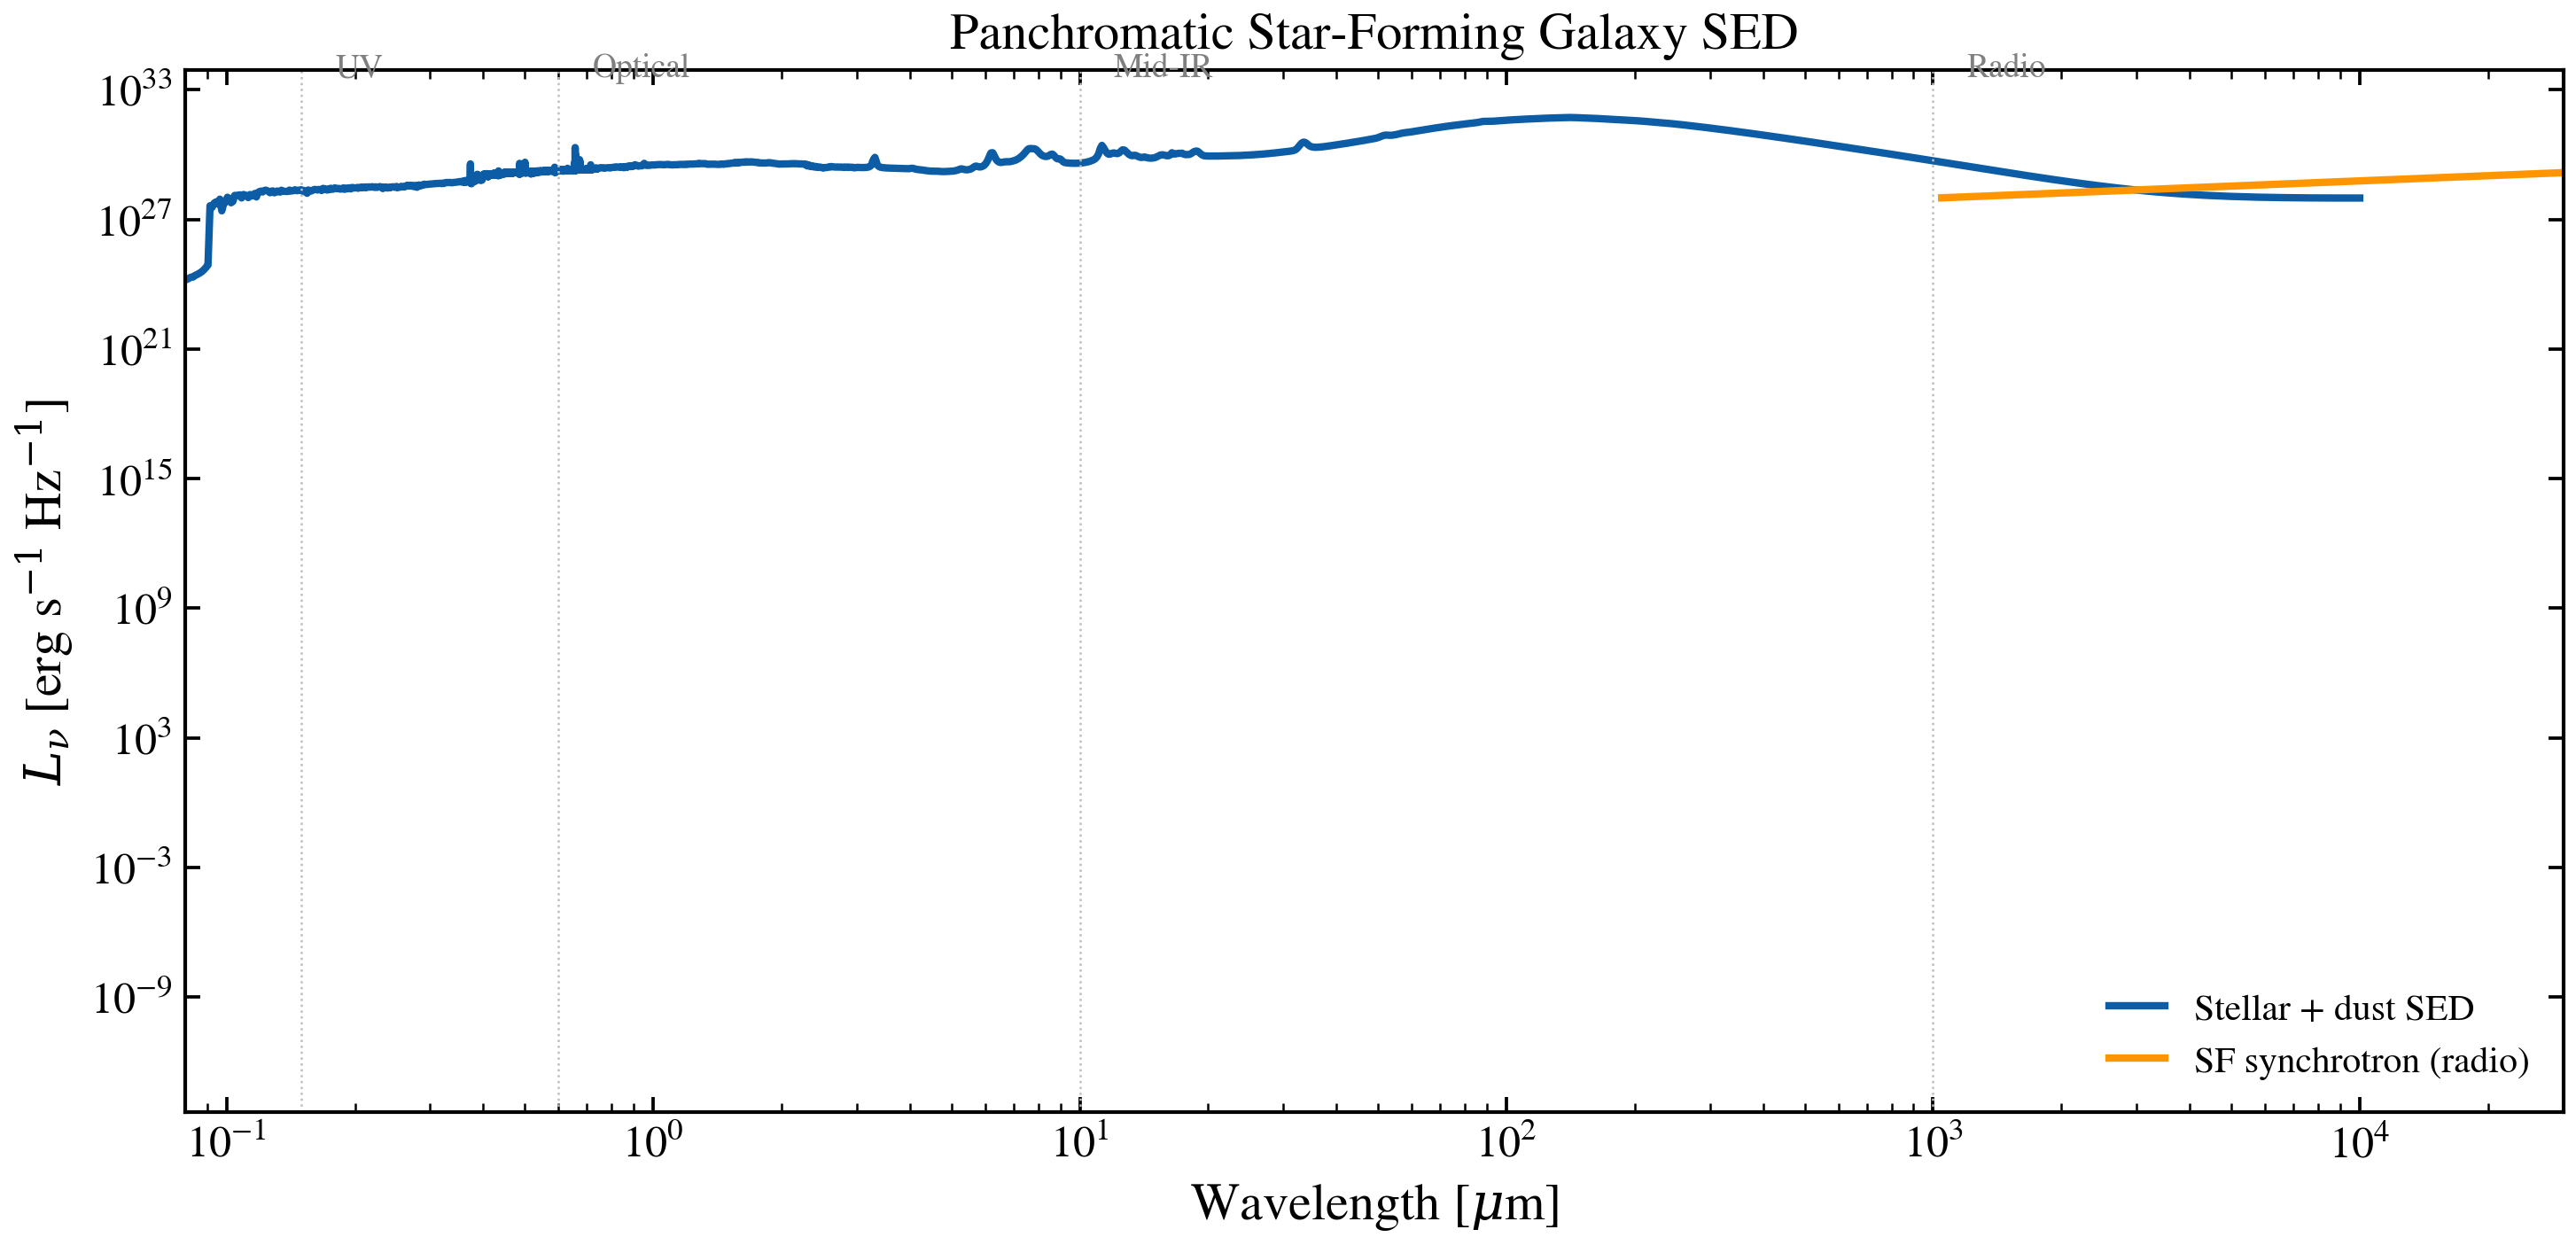
Panchromatic Star-Forming Galaxy
A star-forming galaxy SED from the far-UV to radio, built by combining tengri’s differentiable stellar population model with analytical radio synchrotron and free-free emission. Decomposed into stellar continuum, dust-attenuated emission, dust IR, and radio components.
Requires SSP grid (data/ssp_prsc_miles_*.h5).
from pathlib import Path

import jax
import jax.numpy as jnp
import matplotlib.pyplot as plt
import numpy as np

jax.config.update("jax_enable_x64", True)

from tengri import (
    Fixed,
    Observation,
    Parameters,
    SEDModel,
    Spectroscopy,
    load_ssp_data,
    setup_style,
)
from tengri.radio import radio_star_forming

setup_style()


def _find_ssp():
    name = "ssp_prsc_miles_chabrier_wNE_logGasU-3.0_logGasZ0.0.h5"
    for p in [
        Path("data") / name,
        Path("../data") / name,
        Path("../../data") / name,
        Path("../../../data") / name,
    ]:
        if p.exists():
            return str(p)
    return None


SSP_PATH = _find_ssp()
if SSP_PATH is None:
    raise FileNotFoundError("SSP data not found — skipping example")

ssp = load_ssp_data(SSP_PATH)

# Wavelength grid: UV through near-IR for SEDModel, radio appended separately
wave_sed = jnp.logspace(jnp.log10(1000.0), jnp.log10(1e7), 800)  # 0.1 µm – 1 mm [Å]
obs = Observation(spectroscopy=Spectroscopy(wave_obs=wave_sed))

spec = Parameters(
    mean_sfh_type="tsnorm",
    dust_emission="draine_li2007",
    sfh_tsnorm_log_peak_sfr=Fixed(1.2),  # peak SFR ~ 16 Msun/yr
    sfh_tsnorm_peak_lbt_gyr=Fixed(3.0),
    sfh_tsnorm_width_gyr=Fixed(2.5),
    sfh_tsnorm_skew=Fixed(0.0),
    sfh_tsnorm_trunc=Fixed(2.0),
    met_logzsol=Fixed(0.0),
    dust_tau_bc=Fixed(0.5),
    dust_tau_diff=Fixed(0.3),
    dust_slope=Fixed(-0.7),
    dust_umin=Fixed(2.0),
    dust_qpah=Fixed(3.5),
    dust_gamma_dl=Fixed(0.02),
    redshift=Fixed(0.05),
)

model = SEDModel(spec, ssp, observation=obs)
key = jax.random.PRNGKey(0)
params = spec.sample(key)
pred = model.predict_rest_sed(params)

wave_um = np.array(pred.wavelength) / 1e4  # Å → µm
l_nu = np.array(pred.sed)

# Radio synchrotron (append separately — radio_star_forming needs Å)
wave_radio = jnp.logspace(7, 11, 200)  # 1 mm – 10 m in Å
L_ir_erg = 3e11 * 3.839e33  # ~10^11.5 L_sun IR luminosity
l_radio = np.array(radio_star_forming(wave_radio, L_ir=L_ir_erg, alpha_sf=0.8))
wave_radio_um = np.array(wave_radio) / 1e4

fig, ax = plt.subplots(figsize=(10, 5))

# SED components
mask = l_nu > 0
ax.loglog(wave_um[mask], l_nu[mask], color="C0", lw=2.0, label="Stellar + dust SED")

mask_r = l_radio > 0
ax.loglog(
    wave_radio_um[mask_r], l_radio[mask_r], color="C2", lw=2.0, label="SF synchrotron (radio)"
)

# Set y-limits BEFORE drawing region labels so they place correctly.
ax.set_ylim(1e25, 1e34)

# Wavelength regime labels (placed at fixed fraction of the y-axis).
for x, lbl in [(0.15, "UV"), (0.6, "Optical"), (10.0, "Mid-IR"), (300.0, "FIR"), (1e4, "Radio")]:
    ax.axvline(x, color="0.75", lw=0.6, ls=":")
    ax.text(
        x * 1.2,
        0.92,
        lbl,
        fontsize=9,
        color="0.5",
        transform=ax.get_xaxis_transform(),
    )

ax.set_xlabel(r"Wavelength [$\mu$m]")
ax.set_ylabel(r"$L_\nu$ [erg s$^{-1}$ Hz$^{-1}$]")
ax.set_title("Panchromatic Star-Forming Galaxy SED")
ax.legend(frameon=False, fontsize=10)
ax.set_xlim(0.08, 3e4)
fig.tight_layout()

plt.savefig("plot_panchromatic_galaxy.png", dpi=150, bbox_inches="tight")
plt.show()