Note
Go to the end to download the full example code.
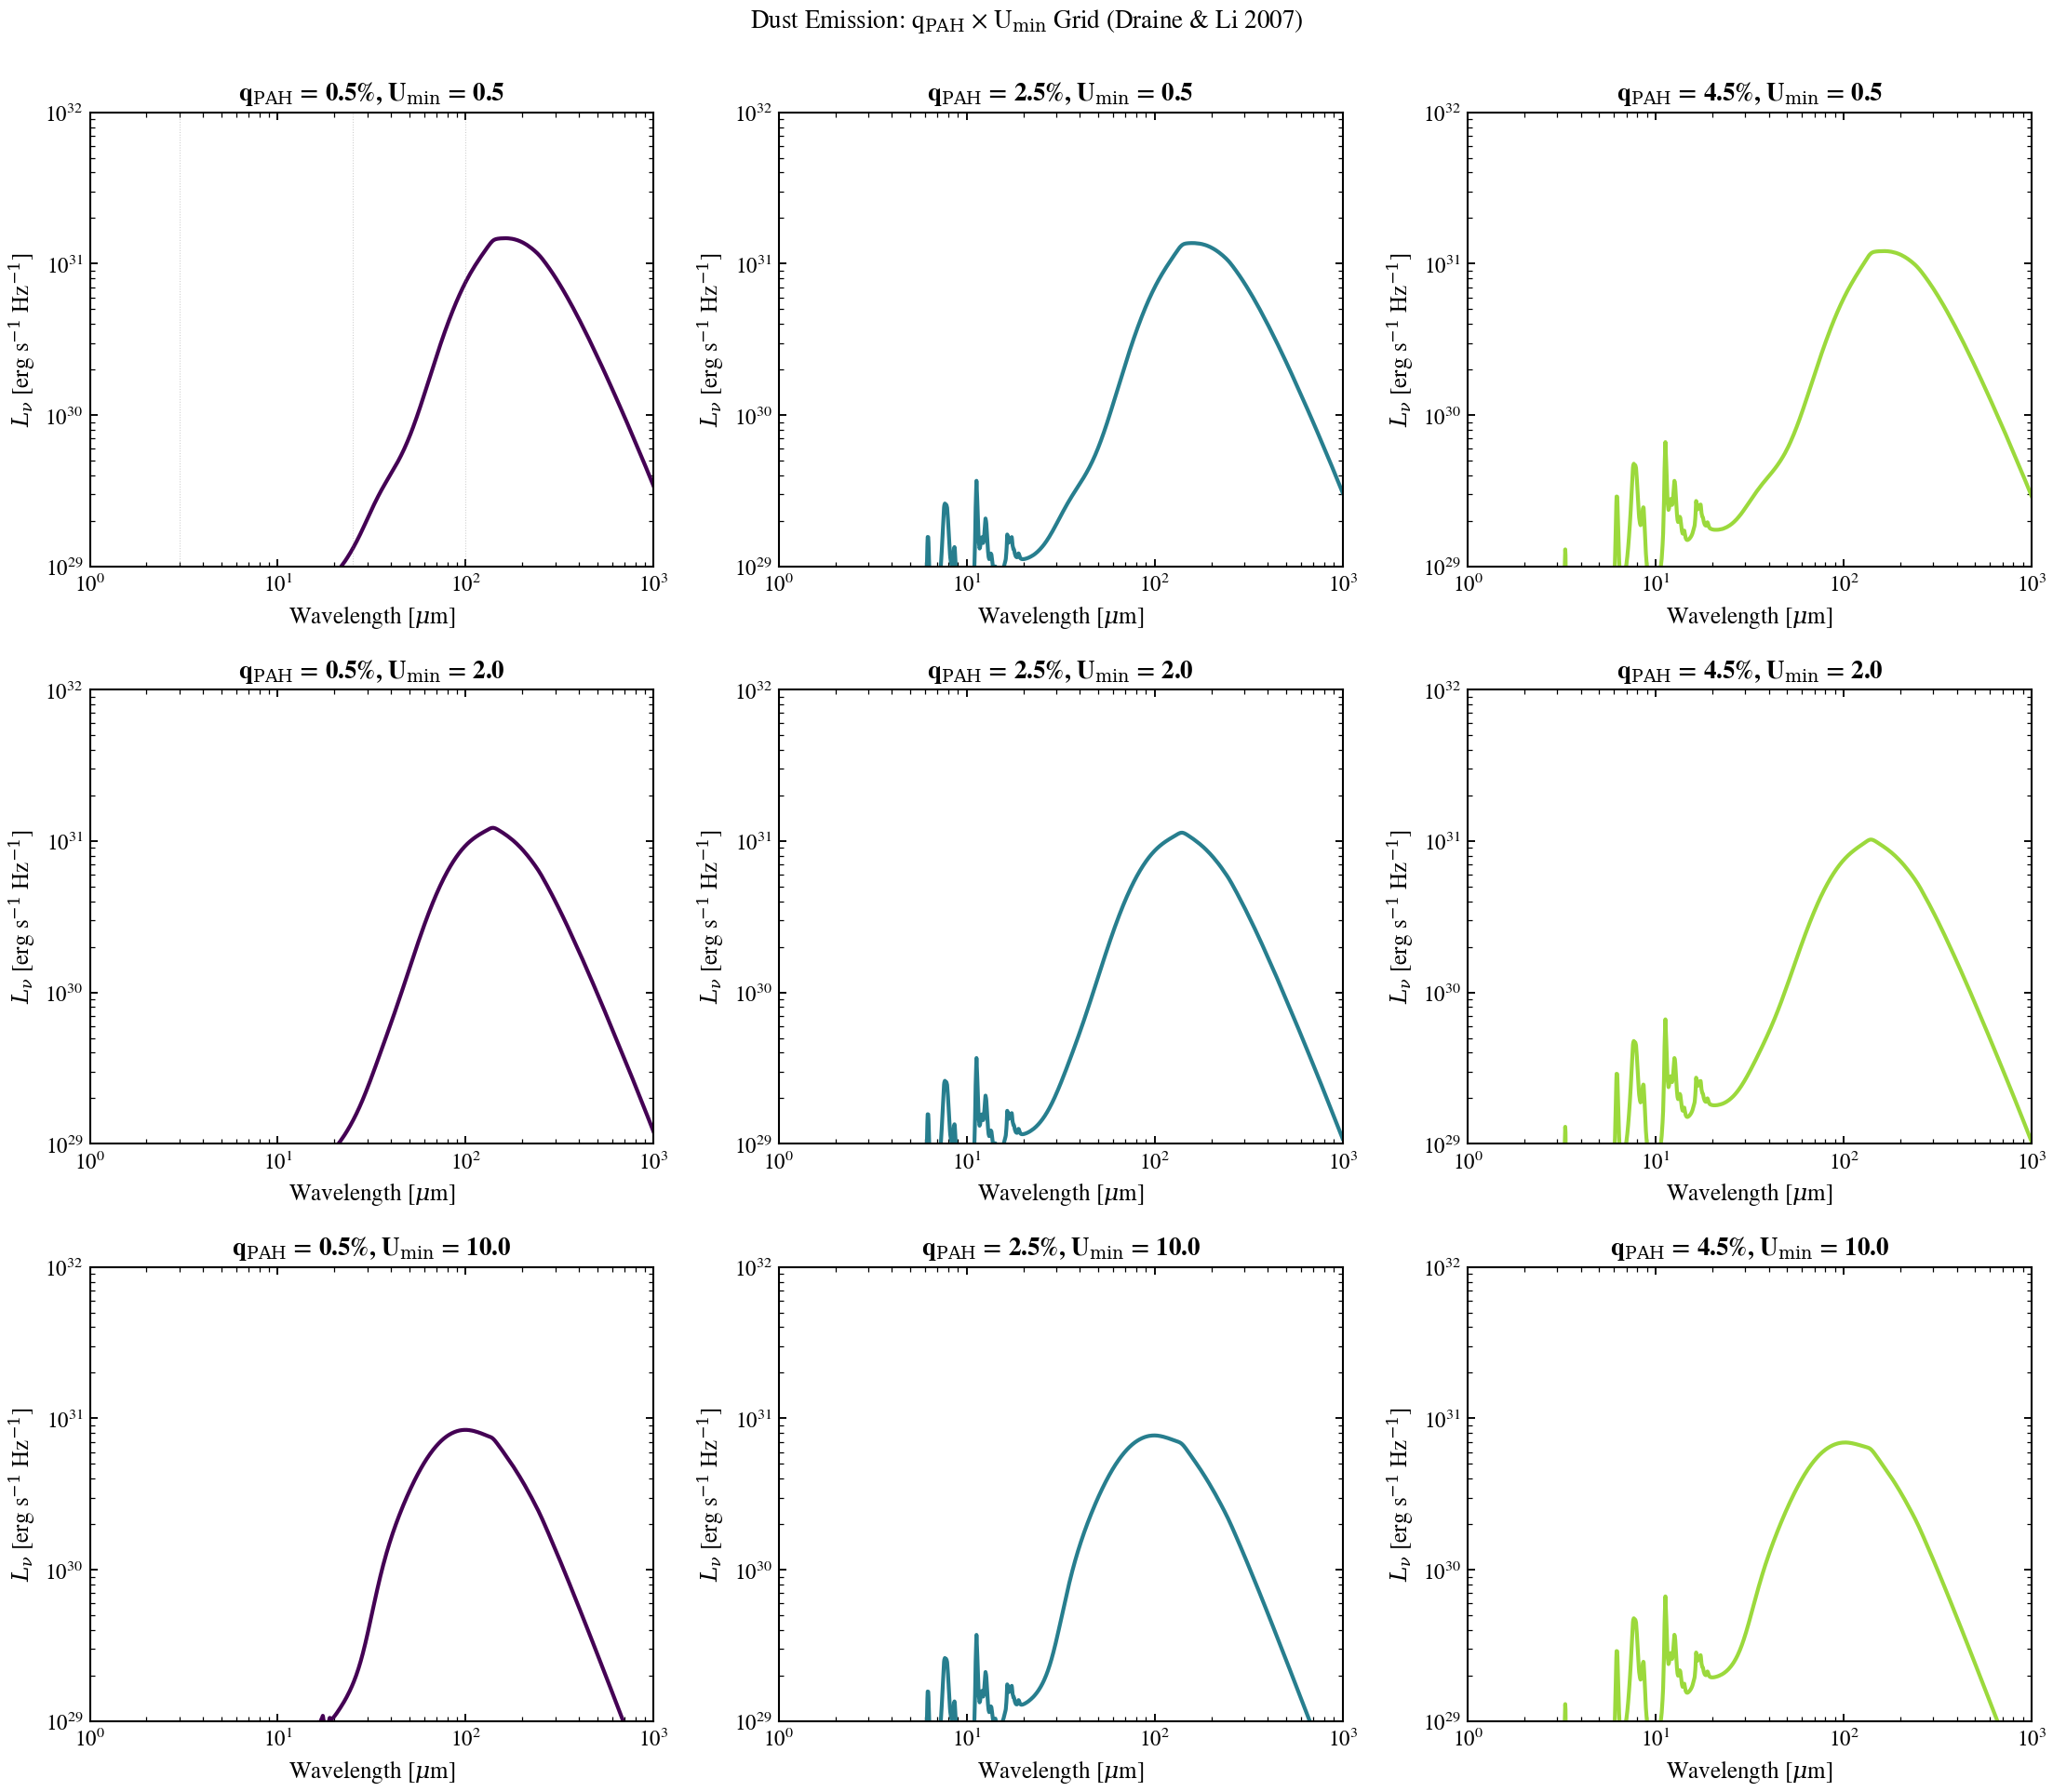
Dust IR SED: q_PAH × U_min Grid
2D grid of dust IR emission spectra showing how PAH mass fraction (q_PAH) and ISRF hardness (U_min) independently shape the mid- and far-infrared SED. Uses Draine & Li 2007 templates. 3×3 panel grid covering q_PAH ∈ {0.5, 2.5, 4.5}% and U_min ∈ {0.5, 2, 10} (MW-like to very hard radiation field).
import jax.numpy as jnp
import matplotlib.pyplot as plt
import numpy as np

from tengri.analysis.plotting import setup_style
from tengri.dust import draine_li2007

setup_style()

# --- Wavelength grid for IR (1–1000 μm) ---
wave_aa = jnp.logspace(np.log10(1e4), np.log10(1e7), 2000)
wave_um = np.array(wave_aa) * 1e-4

# --- Dust emission parameters ---
L_ABS = 1e10 * 3.828e33  # 10^10 L_sun in erg/s
qpah_values = [0.5, 2.5, 4.5]  # PAH mass fraction (%)
umin_values = [0.5, 2.0, 10.0]  # ISRF hardness

# --- Color map (viridis across panels) ---
colors_grid = plt.cm.viridis(np.linspace(0.0, 0.85, 3))

fig, axes = plt.subplots(3, 3, figsize=(15, 13))
fig.suptitle(
    r"Dust Emission: q$_{\rm PAH}$ × U$_{\rm min}$ Grid (Draine & Li 2007)",
    fontsize=13,
    y=0.995,
)

for i, umin in enumerate(umin_values):
    for j, qpah in enumerate(qpah_values):
        ax = axes[i, j]

        try:
            lnu = draine_li2007(wave_aa, L_ABS, dust_umin=umin, dust_gamma_dl=0.01, dust_qpah=qpah)
        except FileNotFoundError:
            ax.text(
                0.5,
                0.5,
                "Data not found\n(use synthetic)",
                ha="center",
                va="center",
                transform=ax.transAxes,
                fontsize=10,
            )
            ax.set_xlabel(r"Wavelength [$\mu$m]")
            ax.set_ylabel(r"$L_\nu$ [erg s$^{-1}$ Hz$^{-1}$]")
            continue

        y = np.array(lnu)
        mask = (wave_um > 1) & (y > 0)
        ax.loglog(wave_um[mask], y[mask], color=colors_grid[j], lw=2.0)

        # --- Panel labels and metadata ---
        ax.set_xlabel(r"Wavelength [$\mu$m]", fontsize=12)
        ax.set_ylabel(r"$L_\nu$ [erg s$^{-1}$ Hz$^{-1}$]", fontsize=12)
        ax.set_xlim(1, 1000)
        ax.set_ylim(1e29, 1e32)
        ax.tick_params(labelsize=11)

        # Title shows parameters
        ax.set_title(
            f"q$_{{\\rm PAH}}$ = {qpah:.1f}%, U$_{{\\rm min}}$ = {umin:.1f}",
            fontsize=13,
            fontweight="bold",
        )

        # Mark key wavelengths on corner panel only
        if i == 0 and j == 0:
            for wl_um, _wl_label in [(3, "PAH"), (25, "mid-IR"), (100, "far-IR")]:
                ax.axvline(wl_um, color="grey", ls=":", lw=0.5, alpha=0.4)

fig.tight_layout()
plt.savefig("plot_dust_qpah_umin_grid.png", dpi=150, bbox_inches="tight")
plt.show()