Note
Go to the end to download the full example code.
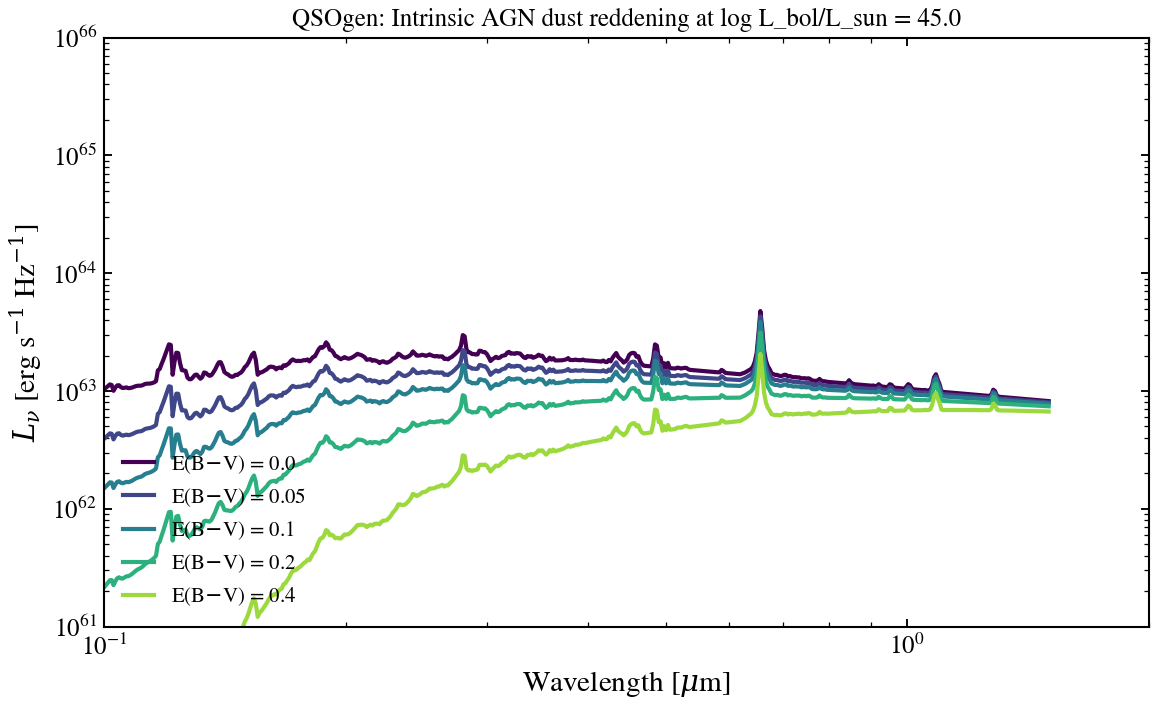
QSOgen Dust Reddening: Intrinsic AGN Obscuration
Sweep agn_ebv from 0.0 to 0.4 on a QSOgen disc at log L_bol = 45. The transition from unobscured UV/optical slopes to reddened spectra traces the obscured-quasar regime.
import jax.numpy as jnp
import matplotlib.pyplot as plt
import numpy as np

from tengri.analysis.plotting import setup_style
from tengri.components.agn import qsogen

setup_style()

# Wavelength grid: UV to near-IR (rest-frame)
wavelength = jnp.logspace(np.log10(1000), np.log10(15000), 512)
wave_um = np.array(wavelength) / 1e4

# Dust reddening E(B-V) values to sweep
ebv_values = [0.0, 0.05, 0.1, 0.2, 0.4]

# Create figure with single panel
fig, ax = plt.subplots(figsize=(8, 5))

# Generate colors from colormap
colors = plt.cm.viridis(np.linspace(0.0, 0.85, len(ebv_values)))

# Fixed AGN luminosity
log_lbol = 45.0

# Sweep dust reddening
for ebv, color in zip(ebv_values, colors):
    sed = np.array(qsogen(wavelength, agn_log_lbol=log_lbol, agn_ebv=ebv))
    sed_safe = np.where(sed > 0, sed, np.nan)
    label = rf"E(B$-$V) = {ebv}"
    ax.loglog(wave_um, sed_safe, lw=2.0, color=color, label=label)

ax.set_xlabel(r"Wavelength [$\mu$m]")
ax.set_ylabel(r"$L_\nu$ [erg s$^{-1}$ Hz$^{-1}$]")
ax.set_title(
    f"QSOgen: Intrinsic AGN dust reddening at log L_bol/L_sun = {log_lbol}",
    fontsize=12,
)
ax.legend(fontsize=10, frameon=False, loc="lower left")
# Broader axis limits for UV–near-IR context
ax.set_xlim(0.1, 2.0)
ax.set_ylim(1e61, 1e66)
ax.grid(False)

fig.tight_layout()
plt.savefig("plot_agn_qsogen_ebv_sweep.png", dpi=150, bbox_inches="tight")
plt.show()