Note
Go to the end to download the full example code.
Escape fraction reshapes the SED from the Lyman continuum to optical lines
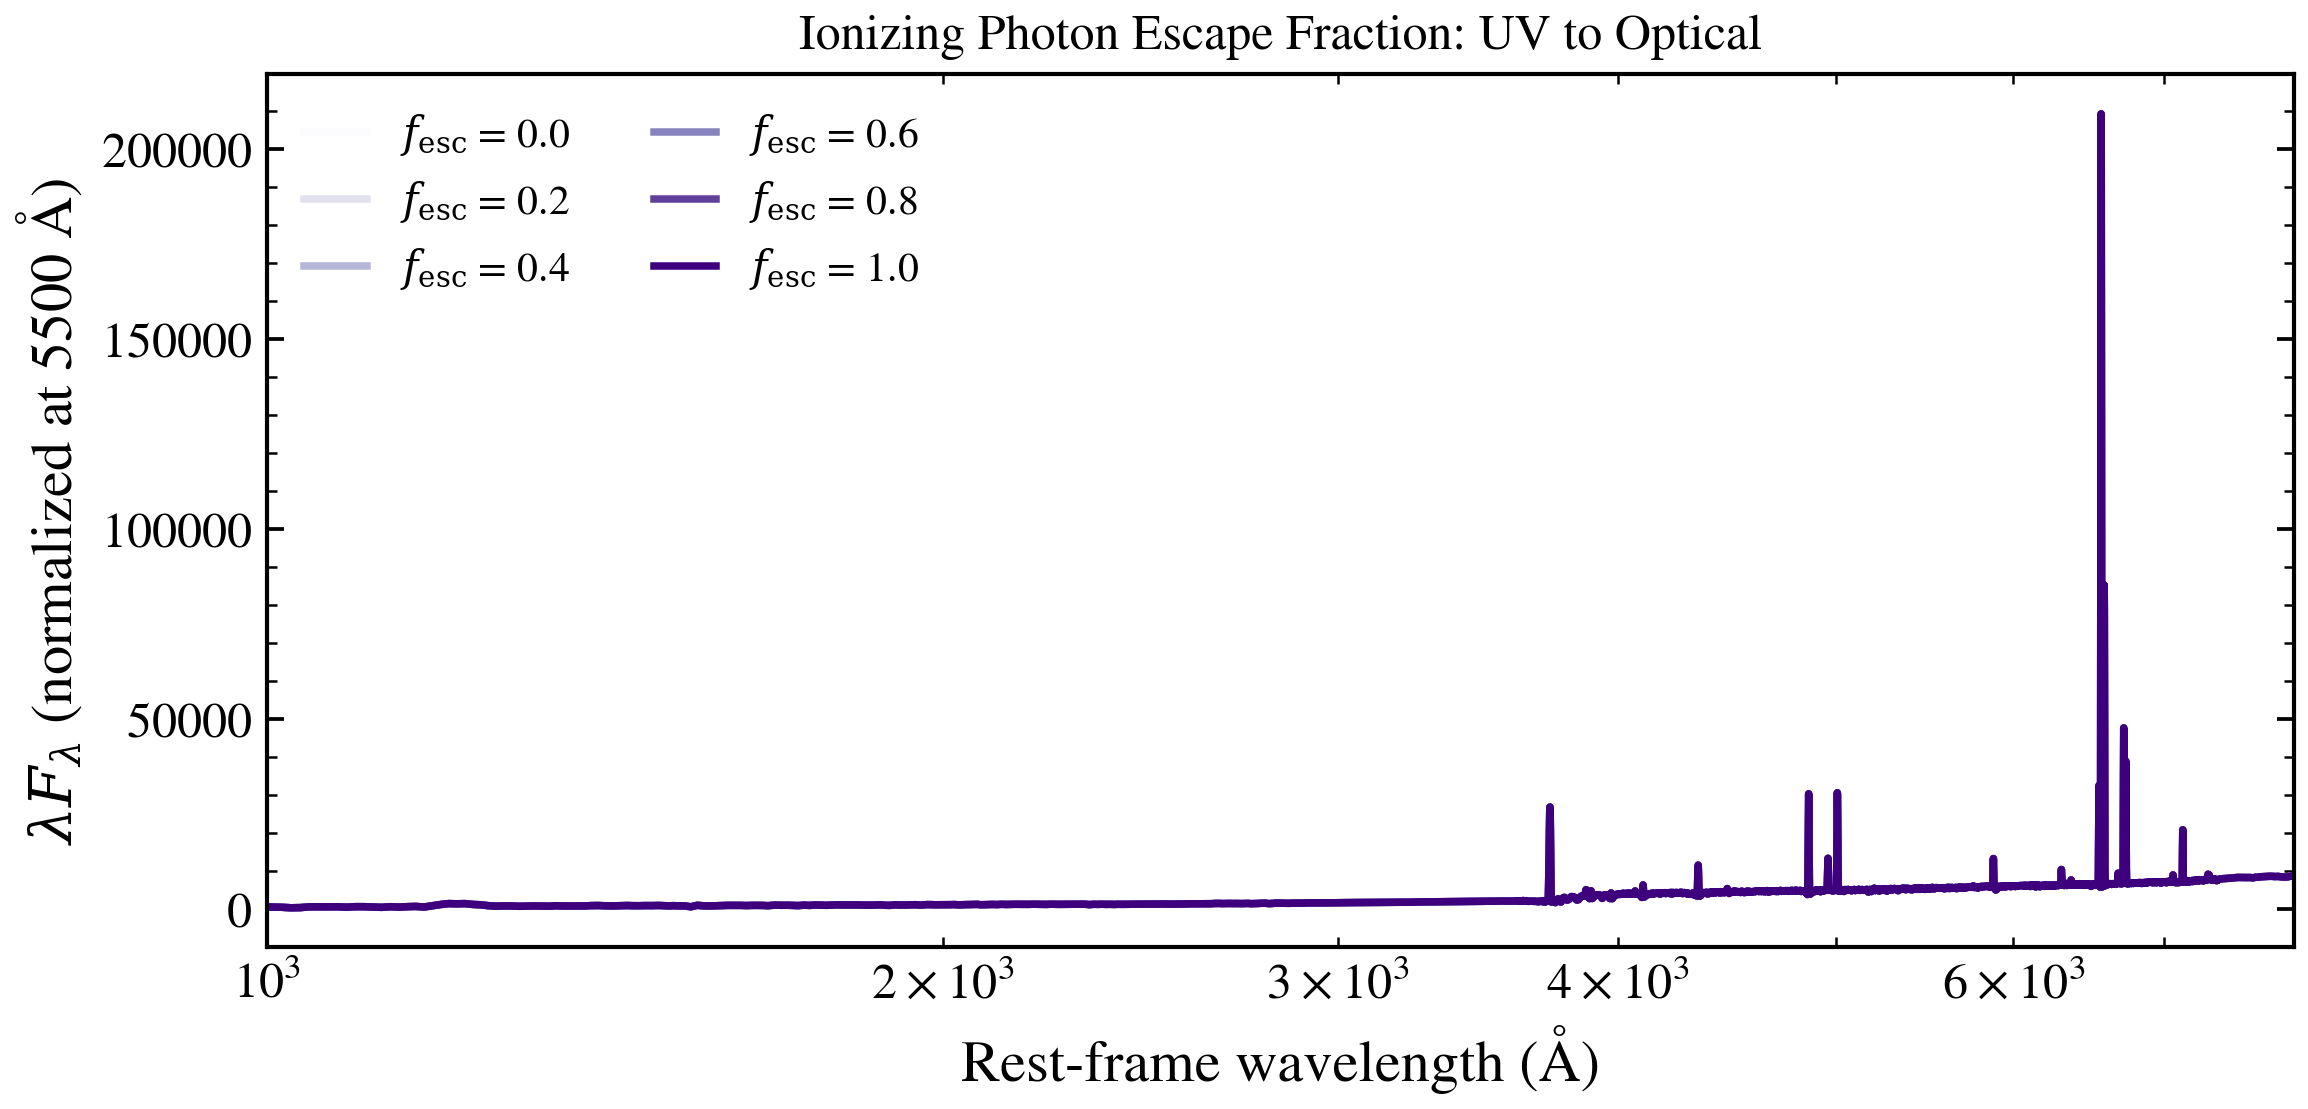
We sweep the ionizing-photon escape fraction f_esc from 0 to 1.0 at fixed log U and metallicity, showing both the broadband SED response and a zoomed view of the critical Lyman-continuum (912 A) region. The Lyman edge deepens as ionizing photons escape the ISM unabsorbed, suppressing optical line ratios simultaneously.
The main plot shows the full SED (800–30000 Å rest), with an inset highlighting the Lyman continuum discontinuity (800–1350 Å). Contours trace how f_esc modulates the ionizing photon budget seen by the ISM.
References:
Inoue et al. 2014, MNRAS, 442, 1805 (escape fraction formalism)
Steidel et al. 2018, ApJ, 869, 123 (Lyman continuum observations)
Li et al. 2025, ApJ, 986, 9 (Cue emulator; arXiv:2405.04598)
/tengri/examples/nebular/plot_fesc_sweep.py:117: UserWarning: This figure includes Axes that are not compatible with tight_layout, so results might be incorrect.
  fig.tight_layout()
import os

os.environ["TF_CPP_MIN_LOG_LEVEL"] = "2"  # suppress XLA/PjRt C++ INFO+WARNING logs

import warnings

import jax
import jax.numpy as jnp
import matplotlib as mpl
import matplotlib.pyplot as plt
import numpy as np
from mpl_toolkits.axes_grid1.inset_locator import inset_axes

import tengri
from tengri.plot import setup_style

setup_style()
warnings.filterwarnings("ignore", message=".*BakedInBackend.*")
warnings.filterwarnings("ignore", message=".*deprecated.*")

ssp = tengri.load_ssp("fsps_prsc_miles_chabrier")
model = tengri.SEDModel.build(
    ssp,
    sfh={
        "type": "dpl",
        "all_params": tengri.Fixed(tengri.DEFAULT),
        "alpha": 1.0,
        "beta": 2.5,
        "tau_gyr": 0.3,
        "log_total_mass": 10.0,
    },
    dust_attenuation={
        "law": "power_law",
        "type": "two_component",
        "all_params": tengri.Fixed(tengri.DEFAULT),
        "tau_diff": 0.0,
        "tau_bc": 0.0,
    },
    neb={
        "type": "cue",
        "all_params": tengri.Fixed(tengri.DEFAULT),
        "fesc": tengri.Uniform(0.0, 1.0),
    },
    redshift=tengri.Fixed(0.05),
)
baseline = dict(model.spec.sample(jax.random.PRNGKey(0)))

fesc_values = np.linspace(0.0, 1.0, 6)
norm = mpl.colors.Normalize(vmin=fesc_values.min(), vmax=fesc_values.max())
cmap = plt.get_cmap("Purples")

# Compute SEDs for all fesc values
seds_by_fesc = {}
for fesc in fesc_values:
    params = {**baseline, "neb_fesc": jnp.float64(fesc)}
    out = model.predict(params)
    wave = np.asarray(model.wavelengths)
    sed = np.asarray(out.rest_sed())
    seds_by_fesc[fesc] = (wave, sed)

# Main plot with full SED
fig, ax = plt.subplots(figsize=(7.0, 4.5))
for fesc in fesc_values:
    wave, sed = seds_by_fesc[fesc]
    nu = 2.998e18 / wave
    nu_l_nu = nu * sed
    label = f"$f_{{\\mathrm{{esc}}}} = {fesc:.1f}$"
    ax.loglog(wave, nu_l_nu, color=cmap(norm(fesc)), lw=1.5, label=label)

ax.set_xlim(800, 3e4)
ax.set_ylim(1e40, 5e43)
ax.set_xlabel(r"Rest-frame wavelength $\lambda$ [$\mathrm{\AA}$]", fontsize=11)
ax.set_ylabel(r"$\nu L_\nu$  [erg s$^{-1}$]", fontsize=11)

cbar = fig.colorbar(plt.cm.ScalarMappable(norm=norm, cmap=cmap), ax=ax, pad=0.01)
cbar.set_label(r"$f_{\mathrm{esc}}$", fontsize=10)

# Inset: zoom on Lyman continuum region (800–1350 Å)
ax_inset = inset_axes(ax, width="35%", height="35%", loc="lower left", borderpad=1.5)
for fesc in fesc_values:
    wave, sed = seds_by_fesc[fesc]
    mask = (wave >= 800) & (wave <= 1350)
    if np.any(mask):
        nu = 2.998e18 / wave[mask]
        nu_l_nu = nu * sed[mask]
        ax_inset.loglog(wave[mask], nu_l_nu, color=cmap(norm(fesc)), lw=1.2, alpha=0.9)

ax_inset.axvline(912, color="gray", linestyle="--", lw=0.7, alpha=0.6, label="Lyman edge")
ax_inset.set_xlim(800, 1350)
ax_inset.set_xlabel(r"$\lambda$ [$\mathrm{\AA}$]", fontsize=9)
ax_inset.set_ylabel(r"$\nu L_\nu$", fontsize=9)
ax_inset.grid(True, which="both", alpha=0.2, linestyle=":")
ax_inset.tick_params(labelsize=8)

fig.tight_layout()
plt.savefig("plot_fesc_sweep.png", dpi=150, bbox_inches="tight")
Total running time of the script: (0 minutes 4.270 seconds)