Note
Go to the end to download the full example code.
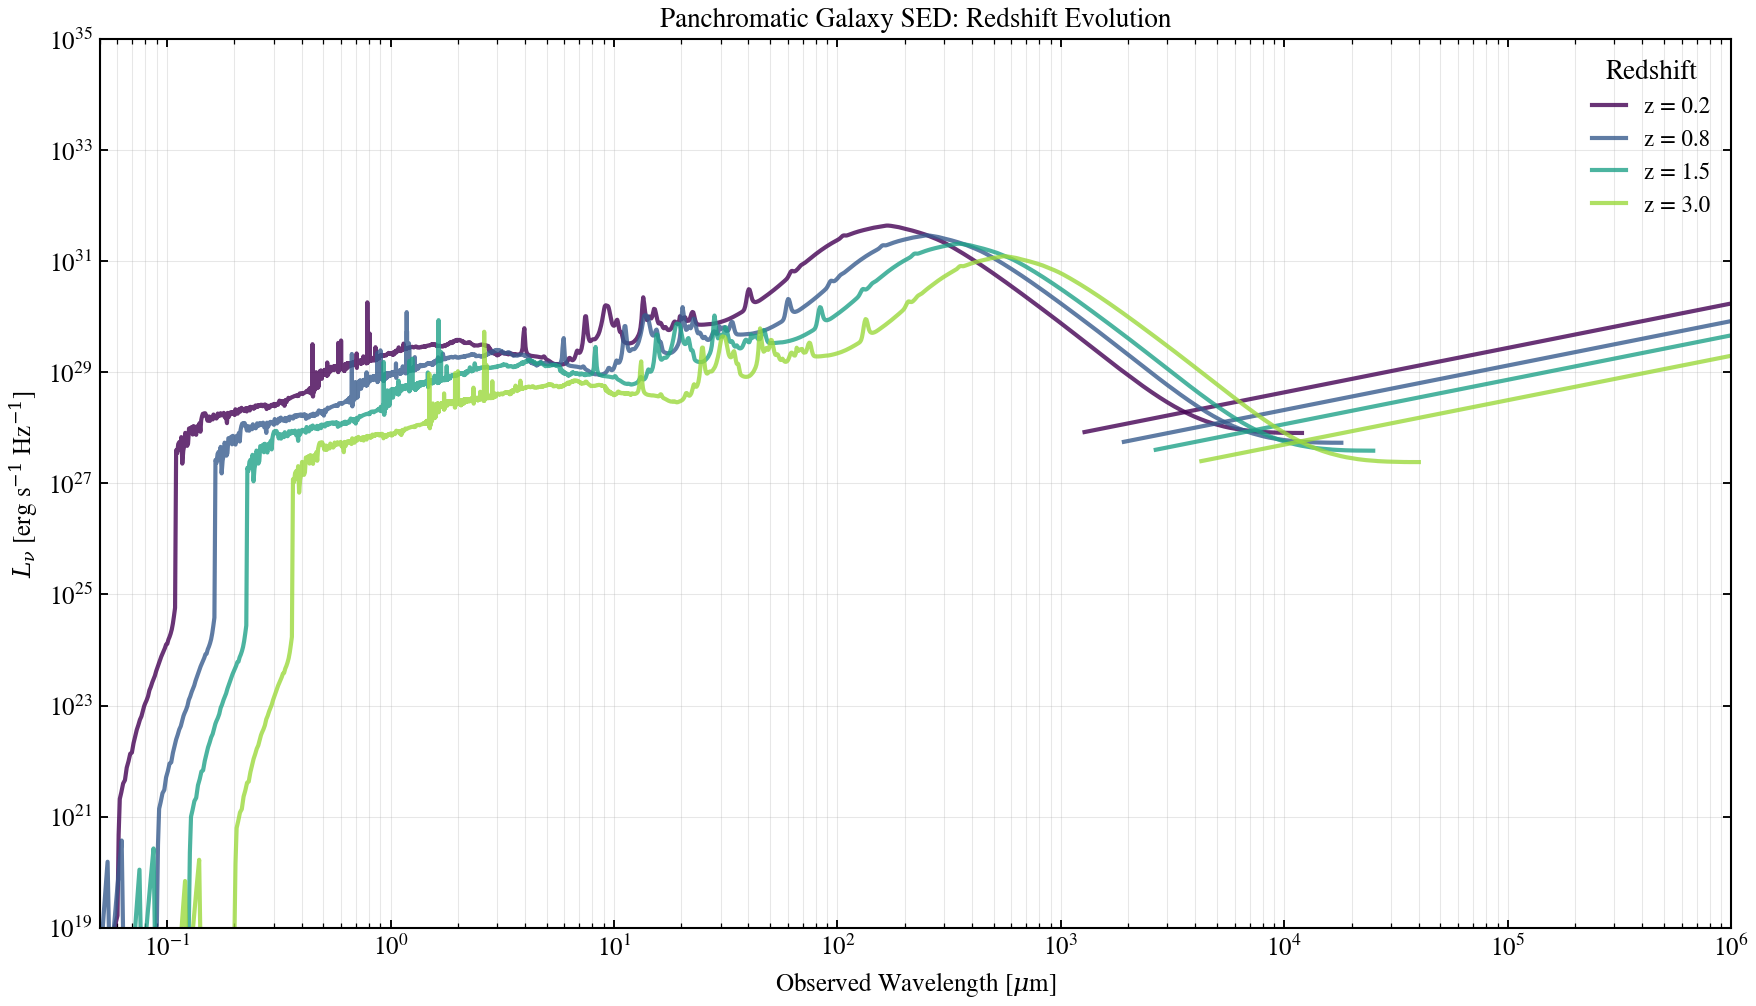
Panchromatic SED: Redshift Evolution
Take a star-forming galaxy SED and observe how it transforms in observed-frame wavelength when placed at increasing redshifts (z=0.1, 0.5, 1.0, 2.0, 4.0). The same rest-frame panchromatic structure (UV, optical, IR, radio) shifts to longer observed wavelengths, enabling photometric surveys to probe different physical regions at different epochs.
Requires SSP grid (data/ssp_prsc_miles_*.h5).
from pathlib import Path

import jax
import jax.numpy as jnp
import matplotlib.pyplot as plt
import numpy as np

jax.config.update("jax_enable_x64", True)

from tengri import (
    Fixed,
    Observation,
    Parameters,
    SEDModel,
    Spectroscopy,
    load_ssp_data,
    setup_style,
)
from tengri.radio import radio_star_forming

setup_style()


def _find_ssp():
    """Find SSP data file in standard locations."""
    name = "ssp_prsc_miles_chabrier_wNE_logGasU-3.0_logGasZ0.0.h5"
    for p in [
        Path("data") / name,
        Path("../data") / name,
        Path("../../data") / name,
        Path("../../../data") / name,
    ]:
        if p.exists():
            return str(p)
    return None


ssp_path = _find_ssp()
if ssp_path is None:
    raise FileNotFoundError("SSP data not found — skipping example")

ssp = load_ssp_data(ssp_path)

# Wavelength grid: UV through radio (in rest-frame Å)
wave_sed = jnp.logspace(jnp.log10(1000.0), jnp.log10(1e7), 800)

# Redshifts to sweep (limited to 4 to avoid crowding)
redshifts = [0.2, 0.8, 1.5, 3.0]
colors = plt.cm.viridis(np.linspace(0.0, 0.85, len(redshifts)))

fig, ax = plt.subplots(figsize=(12, 7))

key = jax.random.PRNGKey(0)

# Observation setup (shared across loop)
obs = Observation(spectroscopy=Spectroscopy(wave_obs=wave_sed))

for z, color in zip(redshifts, colors):
    # Rebuild spec with fixed redshift
    # Note: Each new SEDModel(spec_z, ...) initializes photometry precomputation
    # (fast <100ms), so the cumulative loop cost is acceptable. The actual
    # predict_rest_sed call is JIT-compiled and cached automatically via
    # tengri's persistent JAX cache (subsequent calls reuse the compiled kernel).
    spec_z = Parameters(
        mean_sfh_type="tsnorm",
        dust_emission="draine_li2007",
        sfh_tsnorm_log_peak_sfr=Fixed(1.2),
        sfh_tsnorm_peak_lbt_gyr=Fixed(3.0),
        sfh_tsnorm_width_gyr=Fixed(2.5),
        sfh_tsnorm_skew=Fixed(0.0),
        sfh_tsnorm_trunc=Fixed(2.0),
        met_logzsol=Fixed(0.0),
        dust_tau_bc=Fixed(0.5),
        dust_tau_diff=Fixed(0.3),
        dust_slope=Fixed(-0.7),
        dust_umin=Fixed(2.0),
        dust_qpah=Fixed(3.5),
        dust_gamma_dl=Fixed(0.02),
        redshift=Fixed(z),
    )
    model = SEDModel(spec_z, ssp, observation=obs)
    params = spec_z.sample(key)

    # Predict rest-frame SED
    pred = model.predict_rest_sed(params)
    wave_rest_um = np.array(pred.wavelength) / 1e4  # Å → µm
    l_nu_rest = np.array(pred.sed)

    # Shift to observed frame
    wave_obs_um = wave_rest_um * (1 + z)
    l_nu_obs = l_nu_rest / (1 + z)  # Cosmological dimming + redshift

    # Radio component (appended)
    wave_radio_rest = jnp.logspace(7, 11, 150)  # Å
    L_ir_erg = 3e11 * 3.839e33
    l_radio_rest = np.array(radio_star_forming(wave_radio_rest, L_ir=L_ir_erg, alpha_sf=0.8))
    wave_radio_obs_um = (wave_radio_rest / 1e4) * (1 + z)
    l_radio_obs = l_radio_rest / (1 + z)

    # Combined observed-frame SED
    mask = l_nu_obs > 0
    mask_r = l_radio_obs > 0

    # Plot combined SED
    if np.any(mask):
        ax.loglog(
            wave_obs_um[mask],
            l_nu_obs[mask],
            lw=2.0,
            color=color,
            alpha=0.8,
            label=f"z = {z}",
        )
    if np.any(mask_r):
        ax.loglog(
            wave_radio_obs_um[mask_r],
            l_radio_obs[mask_r],
            lw=2.0,
            color=color,
            alpha=0.8,
        )

ax.set_xlabel(r"Observed Wavelength [$\mu$m]", fontsize=12)
ax.set_ylabel(r"$L_\nu$ [erg s$^{-1}$ Hz$^{-1}$]", fontsize=12)
ax.set_title("Panchromatic Galaxy SED: Redshift Evolution", fontsize=13)
ax.legend(fontsize=11, frameon=False, loc="upper right", title="Redshift")
ax.set_xlim(0.05, 1e6)
ax.set_ylim(1e19, 1e35)
ax.grid(True, alpha=0.3, which="both")

fig.tight_layout()
plt.savefig("plot_panchromatic_redshift_sweep.png", dpi=150, bbox_inches="tight")
plt.show()