Note
Go to the end to download the full example code.
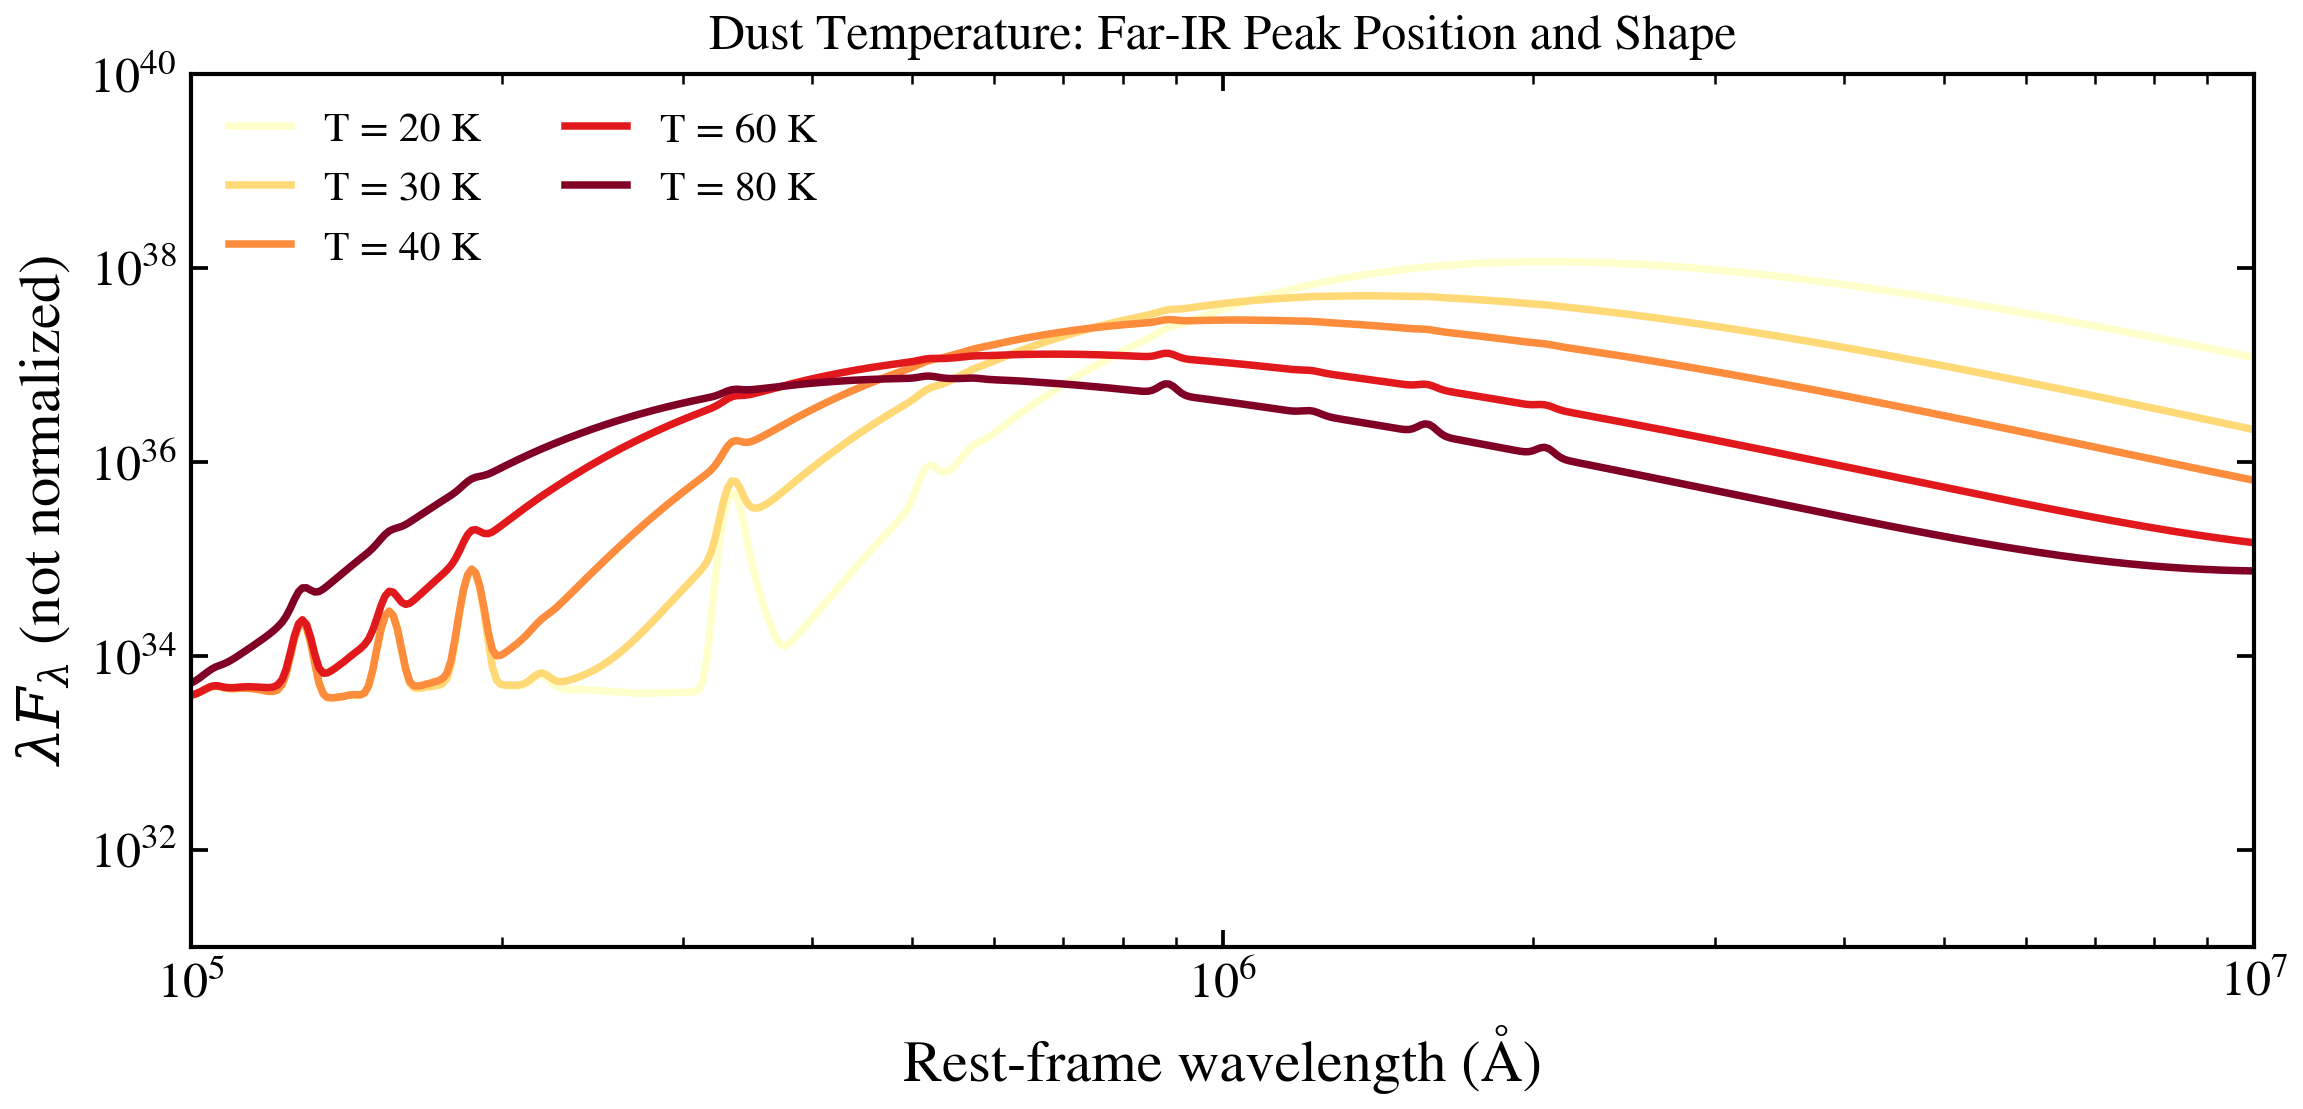
Modified Blackbody Dust Temperature
The characteristic temperature T of the modified blackbody dust emission controls the peak wavelength of far-infrared emission. Wien’s law: λ_peak ≈ 2900 μm·K / T. Hotter dust (higher T) peaks at shorter wavelengths (more mid-IR), cooler dust peaks further into the far-IR/submm.
from pathlib import Path

import jax
import matplotlib.pyplot as plt

jax.config.update("jax_enable_x64", True)

from tengri import Fixed, Parameters, SEDModel, load_ssp_data
from tengri.analysis.plotting import SWEEP_CMAPS, setup_style, sweep_parameter

setup_style()


def _find_ssp():
    """Find SSP data file in standard locations."""
    name = "ssp_prsc_miles_chabrier_wNE_logGasU-3.0_logGasZ0.0.h5"
    for p in [
        Path("data") / name,
        Path("../data") / name,
        Path("../../data") / name,
        Path("../../../data") / name,
    ]:
        if p.exists():
            return str(p)
    return None


SSP_PATH = _find_ssp()
if SSP_PATH is None:
    raise FileNotFoundError("SSP data not found — skipping example")

ssp = load_ssp_data(SSP_PATH)

# --- Build model with dust emission (modified blackbody) ---
spec = Parameters(
    dust_emission="modified_blackbody",
    sfh_tsnorm_log_peak_sfr=Fixed(1.0),
    sfh_tsnorm_peak_lbt_gyr=Fixed(1.5),
    sfh_tsnorm_width_gyr=Fixed(1.0),
    sfh_tsnorm_skew=Fixed(0.2),
    sfh_tsnorm_trunc=Fixed(3.0),
    met_logzsol=Fixed(-0.3),
    dust_tau_bc=Fixed(1.0),
    dust_tau_diff=Fixed(0.5),
    dust_slope=Fixed(-0.7),
    dust_T=Fixed(35),  # Will sweep this
    dust_beta_ir=Fixed(1.6),
    redshift=Fixed(0.1),
)
model = SEDModel(spec, ssp)

# --- Sweep dust_T (Kelvin) ---
# Far-IR range: 10 μm to 1000 μm = 1e5 Å to 1e7 Å
values = [20, 30, 40, 60, 80]

# # The sweep_parameter helper creates a single SEDModel instance and calls
# # model.predict_rest_sed(...) in a loop. JAX JIT compilation is cached
# # automatically via tengri's persistent compilation cache (enabled at
# # import time), so repeated forward model calls reuse the compiled kernel.
fig, ax = sweep_parameter(
    model,
    "dust_T",
    values,
    cmap=SWEEP_CMAPS["dust"],
    label_fmt=r"T = {:.0f} K",
    wave_range=(1e5, 1e7),  # 10 μm to 1000 μm in Ångströms
    normalize_at=None,  # Don't normalize; show absolute flux trend
)
ax.set_yscale("log")
ax.set_xscale("log")
ax.set_ylim(1e31, 1e40)
ax.set_title("Dust Temperature: Far-IR Peak Position and Shape", fontsize=12)
ax.set_ylabel(r"$\lambda F_\lambda$ (not normalized)")
plt.tight_layout()
plt.savefig("plot_dust_T_sweep.png", dpi=150, bbox_inches="tight")
plt.show()