Note
Go to the end to download the full example code.
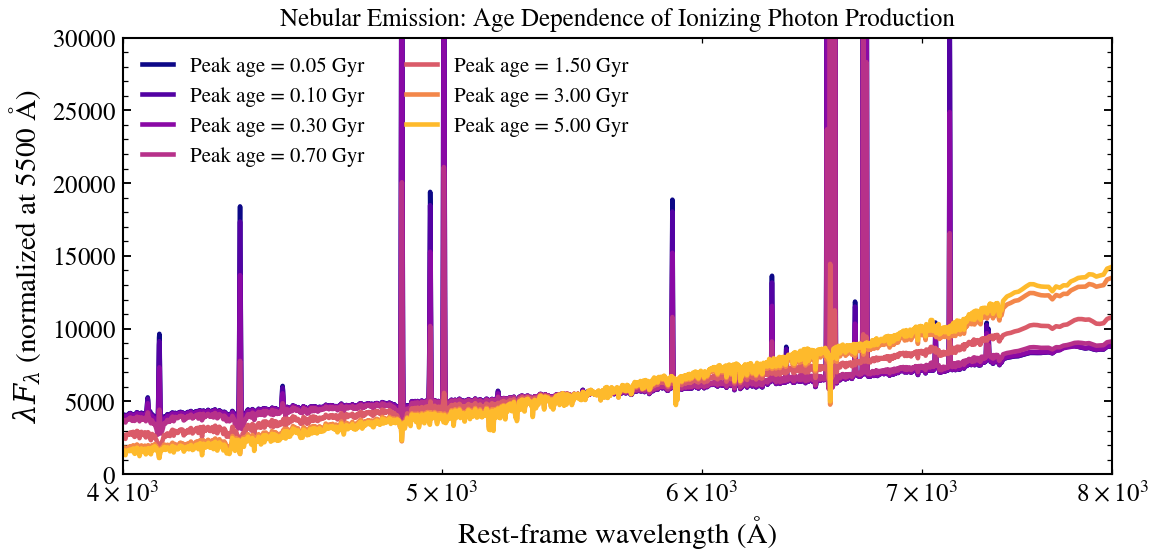
Nebular Emission: Dependence on Stellar Population Age
Ionizing photon production declines rapidly with stellar population age (~t^-1). Compare young vs old populations to see how nebular line strength evolves.
from pathlib import Path

import jax
import matplotlib.pyplot as plt

jax.config.update("jax_enable_x64", True)

from tengri import Fixed, Parameters, SEDModel, load_ssp_data
from tengri.analysis.plotting import setup_style, sweep_parameter

setup_style()


def _find_ssp():
    """Find SSP data file in standard locations."""
    name = "ssp_prsc_miles_chabrier_wNE_logGasU-3.0_logGasZ0.0.h5"
    for p in [
        Path("data") / name,
        Path("../data") / name,
        Path("../../data") / name,
        Path("../../../data") / name,
    ]:
        if p.exists():
            return str(p)
    return None


SSP_PATH = _find_ssp()
if SSP_PATH is None:
    raise FileNotFoundError("SSP data not found — skipping example")

ssp = load_ssp_data(SSP_PATH)

# --- Build model: parametric SFH with variable peak age ---
spec = Parameters(
    sfh_tsnorm_log_peak_sfr=Fixed(1.0),
    sfh_tsnorm_peak_lbt_gyr=Fixed(0.5),  # Will sweep this
    sfh_tsnorm_width_gyr=Fixed(0.3),
    sfh_tsnorm_skew=Fixed(0.2),
    sfh_tsnorm_trunc=Fixed(3.0),
    met_logzsol=Fixed(-0.3),
    dust_tau_bc=Fixed(0.1),
    dust_tau_diff=Fixed(0.1),
    dust_slope=Fixed(-0.7),
    redshift=Fixed(0.1),
)
model = SEDModel(spec, ssp)

# --- Sweep stellar population age (lookback time) ---
values = [0.05, 0.1, 0.3, 0.7, 1.5, 3.0, 5.0]
fig, ax = sweep_parameter(
    model,
    "sfh_tsnorm_peak_lbt_gyr",
    values,
    cmap="plasma",
    label_fmt=r"Peak age = {:.2f} Gyr",
    wave_range=(4000, 8000),
)
ax.set_title("Nebular Emission: Age Dependence of Ionizing Photon Production", fontsize=12)
ax.set_ylabel(r"$\lambda F_\lambda$ (normalized at 5500 Å)")
ax.set_ylim(0, 30_000)
plt.tight_layout()
plt.savefig("plot_neb_age_dependence.png", dpi=150, bbox_inches="tight")
plt.show()