Note
Go to the end to download the full example code.
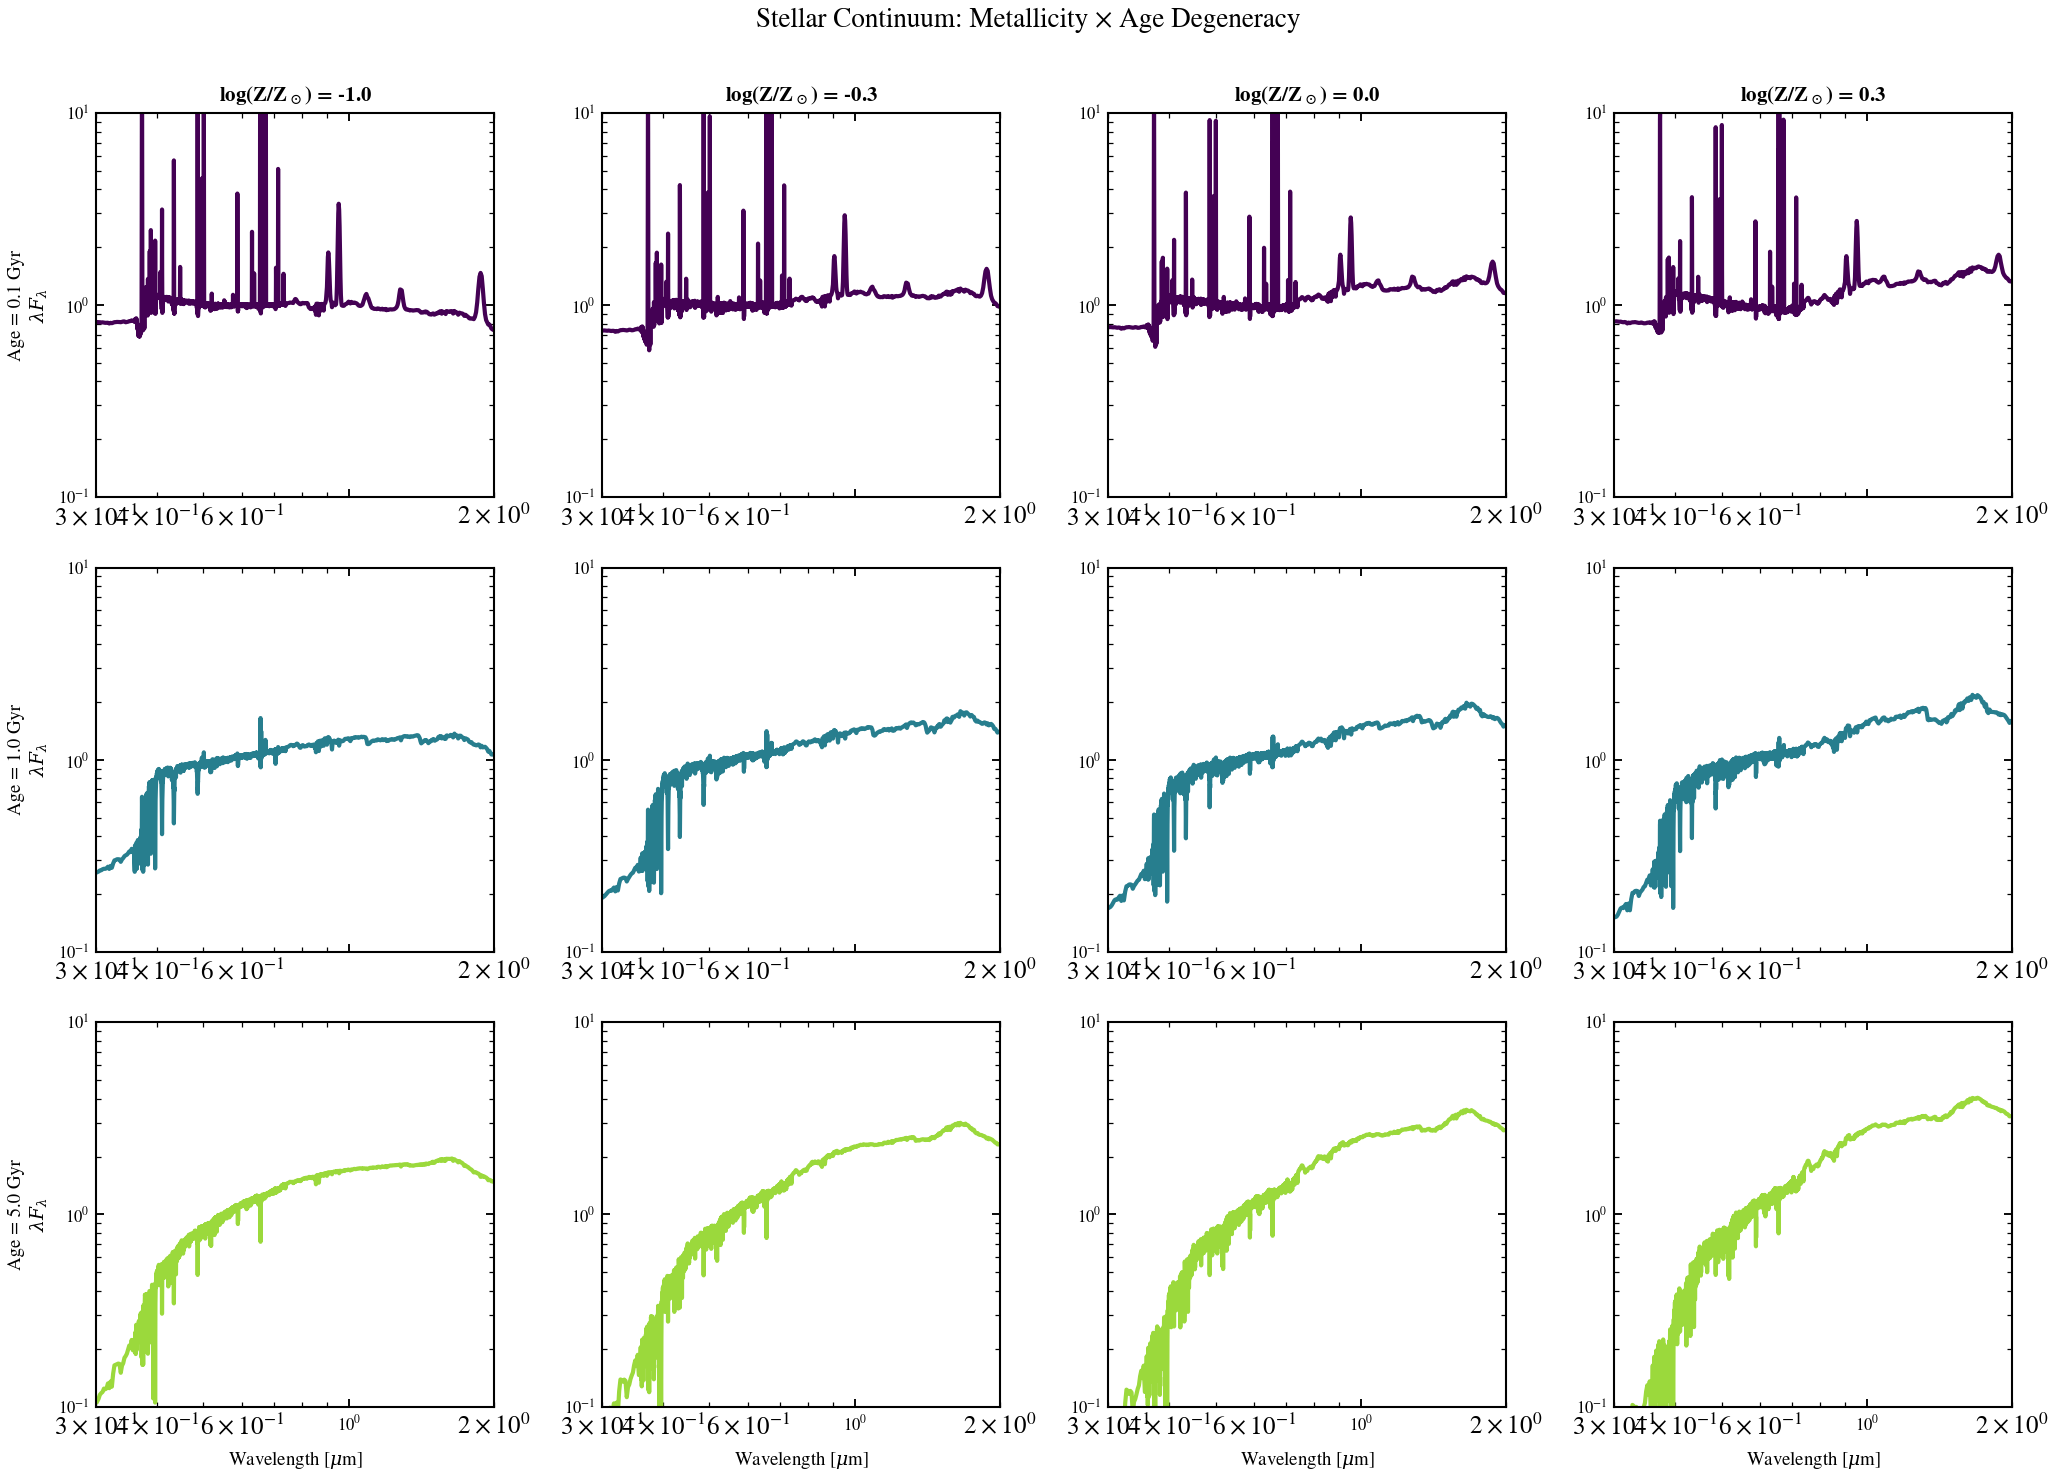
Stellar Continuum: Metallicity × Age Grid
2D grid showing how stellar continuum shape responds to metallicity at different ages. Demonstrates the age-metallicity degeneracy: a metal-rich young star can mimic a metal-poor old star in the optical continuum. Uses a 3×4 panel grid: log(Z/Z_sun) ∈ {-1.0, -0.3, 0.0, 0.3} × age ∈ {0.1, 1.0, 5.0} Gyr.
from pathlib import Path

import jax
import matplotlib.pyplot as plt
import numpy as np

jax.config.update("jax_enable_x64", True)

from tengri import Fixed, Parameters, SEDModel, load_ssp_data
from tengri.analysis.plotting import setup_style

setup_style()


def _find_ssp():
    """Find SSP data file in standard locations."""
    name = "ssp_prsc_miles_chabrier_wNE_logGasU-3.0_logGasZ0.0.h5"
    for p in [
        Path("data") / name,
        Path("../data") / name,
        Path("../../data") / name,
        Path("../../../data") / name,
    ]:
        if p.exists():
            return str(p)
    return None


SSP_PATH = _find_ssp()
if SSP_PATH is None:
    raise FileNotFoundError("SSP data not found — skipping example")

ssp = load_ssp_data(SSP_PATH)

# --- Grid parameters ---
logz_values = [-1.0, -0.3, 0.0, 0.3]  # log(Z/Z_sun)
age_gyr_values = [0.1, 1.0, 5.0]  # Gyr

# --- Color map ---
colors_age = plt.cm.viridis(np.linspace(0.0, 0.85, len(age_gyr_values)))

fig, axes = plt.subplots(len(age_gyr_values), len(logz_values), figsize=(14, 10))
fig.suptitle(
    "Stellar Continuum: Metallicity × Age Degeneracy",
    fontsize=13,
    y=0.995,
)

for i, age_gyr in enumerate(age_gyr_values):
    for j, logz in enumerate(logz_values):
        ax = axes[i, j]

        # --- Build pure-stellar model (no dust, simple SFH) ---
        # Peak the SFH at the given age to make that age dominate the light
        spec = Parameters(
            sfh_tsnorm_log_peak_sfr=Fixed(1.0),
            sfh_tsnorm_peak_lbt_gyr=Fixed(age_gyr),
            sfh_tsnorm_width_gyr=Fixed(0.3),
            sfh_tsnorm_skew=Fixed(0.0),
            sfh_tsnorm_trunc=Fixed(max(3.0, age_gyr + 2.0)),
            met_logzsol=Fixed(logz),  # Vary metallicity
            dust_tau_bc=Fixed(0.0),  # No dust for clean continuum view
            dust_tau_diff=Fixed(0.0),
            dust_slope=Fixed(-0.7),
            redshift=Fixed(0.0),  # No redshift; rest-frame
        )
        model = SEDModel(spec, ssp)

        # Sample parameters and generate SED
        import jax.random

        key = jax.random.PRNGKey(0)
        params = spec.sample(key)
        pred = model.predict_rest_sed(params)

        wavelength = np.array(pred.wavelength)
        sed = np.array(pred.sed)
        wave_um = wavelength / 1e4

        # Normalize at 5500 A
        i_norm = int(np.argmin(np.abs(wavelength - 5500.0)))
        norm_val = sed[i_norm]
        if norm_val > 0:
            sed_norm = sed / norm_val
        else:
            sed_norm = sed

        # Plot: optical + NIR range
        mask = (wave_um > 0.3) & (wave_um < 2.0) & (sed_norm > 0)
        ax.loglog(wave_um[mask], sed_norm[mask], color=colors_age[i], lw=2.0)

        # Labels and formatting
        ax.set_xlim(0.3, 2.0)
        ax.set_ylim(0.1, 10)
        ax.tick_params(labelsize=8)

        # Row labels (age)
        if j == 0:
            ax.set_ylabel(f"Age = {age_gyr:.1f} Gyr\n" + r"$\lambda F_\lambda$", fontsize=9)

        # Column labels (metallicity)
        if i == 0:
            ax.set_title(f"log(Z/Z$_\\odot$) = {logz:.1f}", fontsize=10, fontweight="bold")

        # X-axis only on bottom row
        if i == len(age_gyr_values) - 1:
            ax.set_xlabel(r"Wavelength [$\mu$m]", fontsize=9)
        else:
            ax.set_xticklabels([])

fig.tight_layout()
plt.savefig("plot_metallicity_age_grid.png", dpi=150, bbox_inches="tight")
plt.show()