Note
Go to the end to download the full example code.
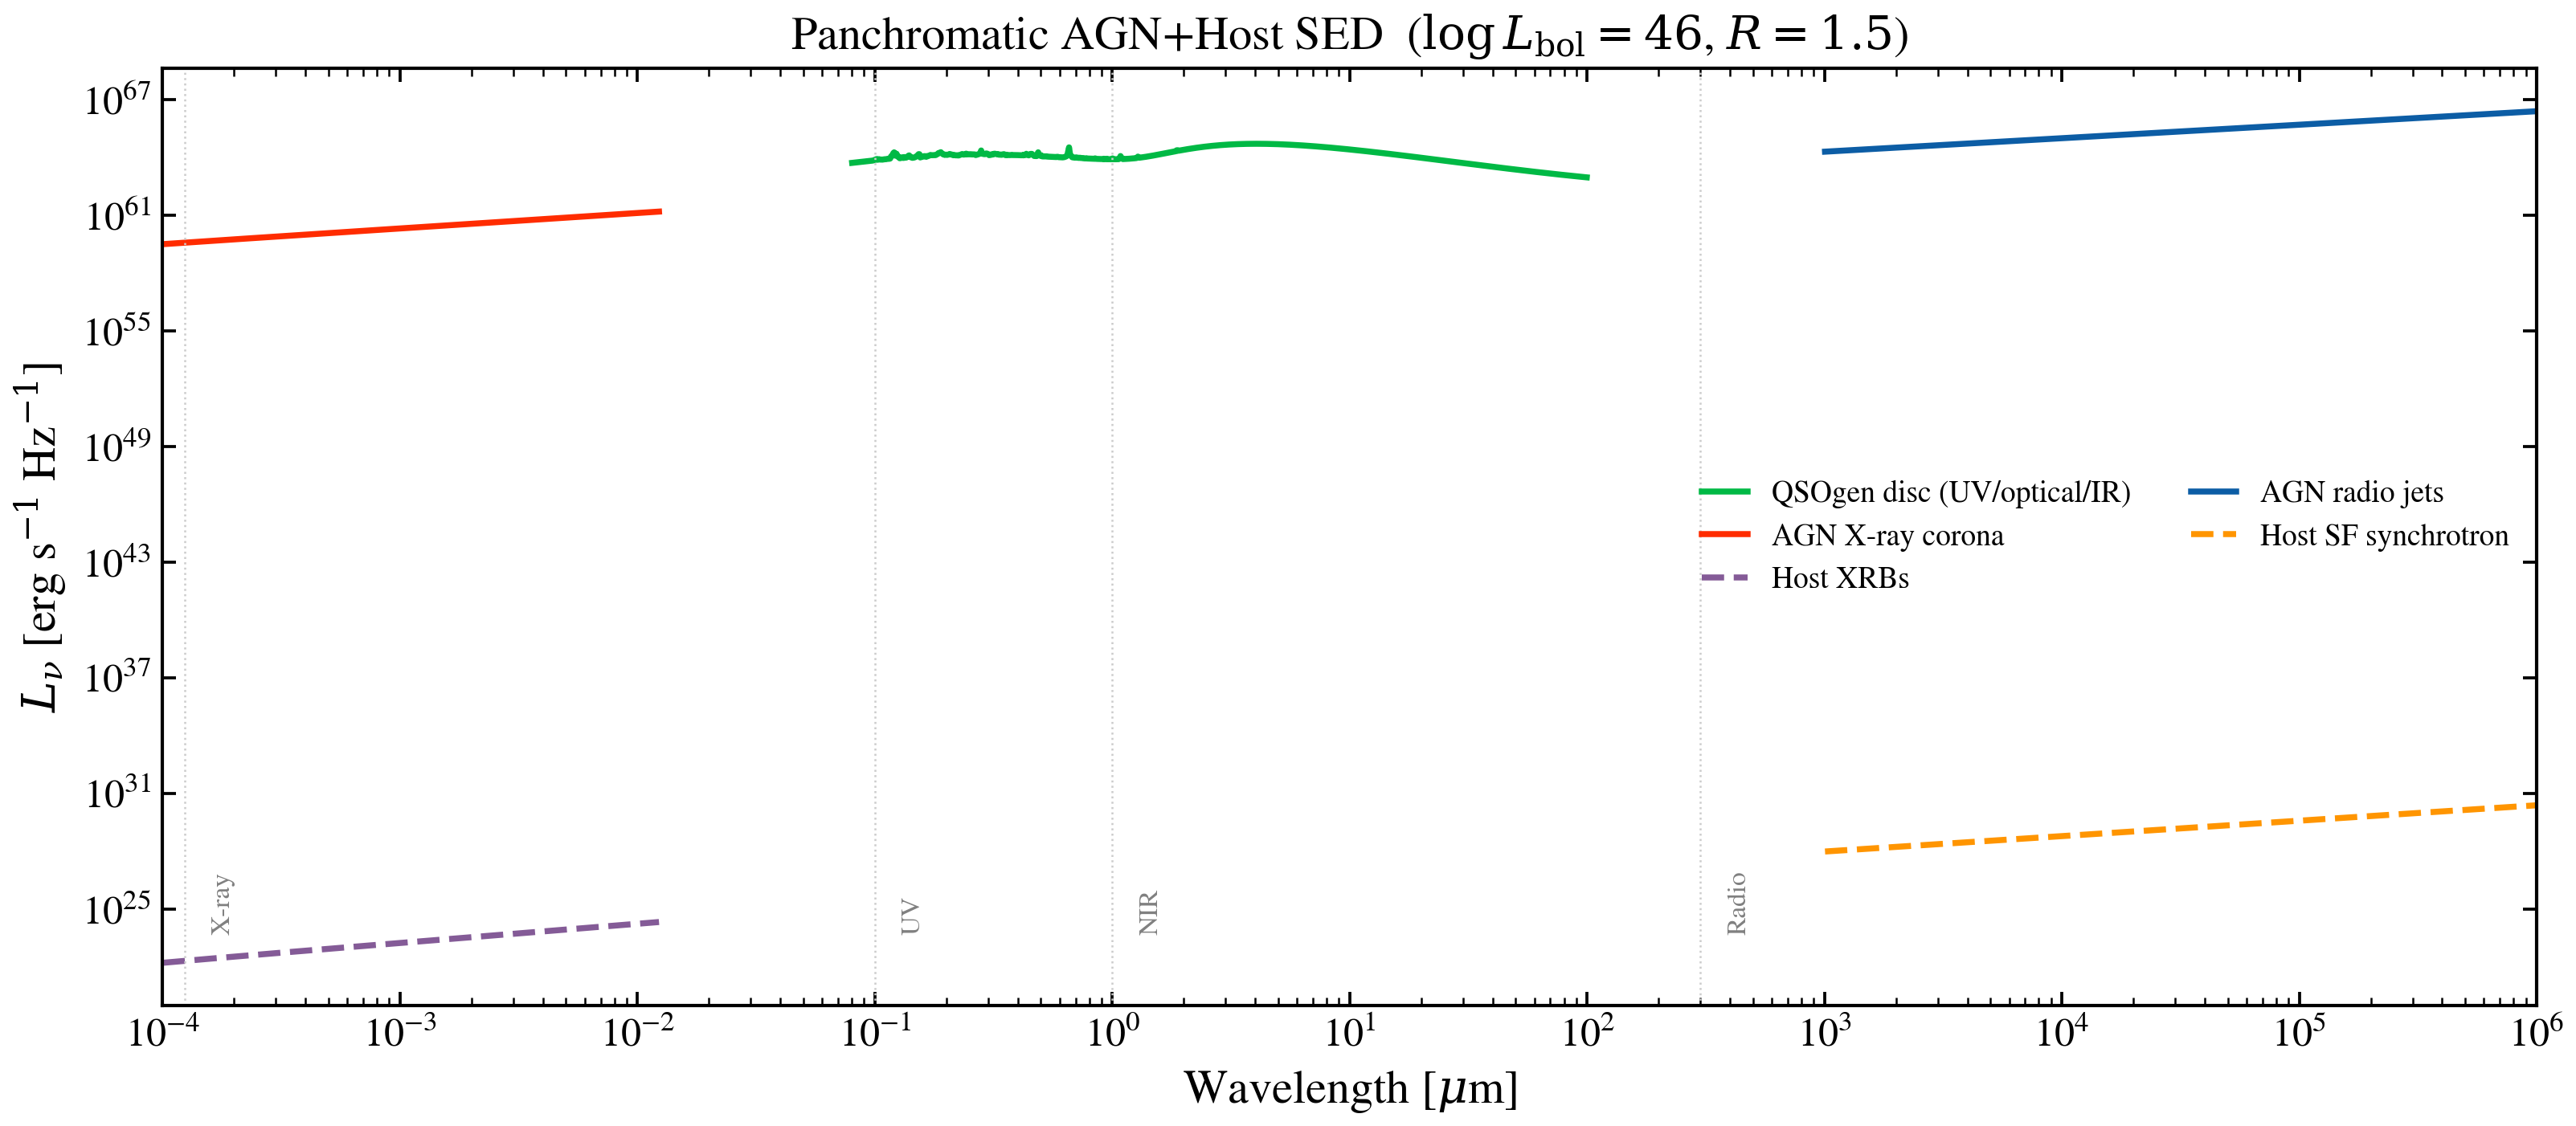
Panchromatic AGN Host SED
Full SED of an AGN host galaxy from hard X-ray (1 keV) to radio (1 GHz), assembled analytically from four physically distinct emission regions. No SSP data required.
Components
AGN disc (optical/UV): QSOgen broken-power-law quasar continuum Temple, Hewett & Banerji 2021.
X-ray corona: Comptonized hard X-ray power law scaled from the AGN disc via the \(\alpha_{OX}\)-\(L_{2500}\) relation.
Radio jets: AGN power-law lobe emission scaled by radio loudness.
Host galaxy radio: Star-formation-driven synchrotron.
import jax.numpy as jnp
import matplotlib.pyplot as plt
import numpy as np

from tengri.analysis.plotting import setup_style
from tengri.components.agn.qsogen import compute_qsogen_sed
from tengri.radio import radio_agn, radio_star_forming
from tengri.xray import xray_agn_corona, xray_xrb

setup_style()

# ── Wavelength grid: 1 Å (hard X-ray) to 1e10 Å (30 cm radio) ───────────────
wave = jnp.logspace(0, 10, 3000)  # Angstrom
wave_um = np.array(wave) / 1e4  # µm

# ── Physical parameters ───────────────────────────────────────────────────────
LOG_LBOL_LSUN = 46.0  # AGN bolometric log L_bol/L_sun
L_AGN_BOL_ERG = 10**LOG_LBOL_LSUN * 3.839e33  # erg/s
SFR = 30.0  # host SFR [Msun/yr]
STELLAR_MASS = 5e10  # host stellar mass [Msun]
L_IR = 3e11 * 3.839e33  # host IR luminosity [erg/s]
RADIO_LOUDNESS = 1.5  # log R = L_1.4GHz/L_4400Å

# ── AGN disc (optical/UV) ─────────────────────────────────────────────────────
wave_uv = wave[(wave >= 800) & (wave <= 1e6)]  # 800 Å – 100 µm
l_disc = np.array(compute_qsogen_sed(jnp.asarray(wave_uv), agn_log_lbol=LOG_LBOL_LSUN))

# ── X-ray corona ──────────────────────────────────────────────────────────────
l_xray_agn = np.array(xray_agn_corona(wave, L_agn_bol=L_AGN_BOL_ERG))

# ── X-ray binaries in the host ────────────────────────────────────────────────
l_xrb = np.array(xray_xrb(wave, sfr=SFR, stellar_mass=STELLAR_MASS))

# ── Radio: AGN jets + host SF synchrotron ─────────────────────────────────────
l_radio_agn = np.array(radio_agn(wave, L_agn_bol=L_AGN_BOL_ERG, radio_loudness=RADIO_LOUDNESS))
l_radio_sf = np.array(radio_star_forming(wave, L_ir=L_IR, alpha_sf=0.8))

# ── Plot ──────────────────────────────────────────────────────────────────────
fig, ax = plt.subplots(figsize=(11, 5))

components = [
    (np.array(wave_uv) / 1e4, l_disc, "C1", "-", r"QSOgen disc (UV/optical/IR)"),
    (wave_um, l_xray_agn, "C3", "-", "AGN X-ray corona"),
    (wave_um, l_xrb, "C4", "--", "Host XRBs"),
    (wave_um, l_radio_agn, "C0", "-", "AGN radio jets"),
    (wave_um, l_radio_sf, "C2", "--", "Host SF synchrotron"),
]

for ww, ll, color, ls, label in components:
    mask = ll > 0
    if not np.any(mask):
        continue
    ax.loglog(ww[mask], ll[mask], color=color, ls=ls, lw=1.8, label=label)

# Regime boundaries
for x_um, lbl in [(1.24e-4, "X-ray"), (0.1, "UV"), (1.0, "NIR"), (300, "Radio")]:
    ax.axvline(x_um, color="0.8", lw=0.6, ls=":")
    ax.text(x_um * 1.3, 5e23, lbl, fontsize=8, color="0.5", rotation=90, va="bottom")

ax.set_xlabel(r"Wavelength [$\mu$m]")
ax.set_ylabel(r"$L_\nu$ [erg s$^{-1}$ Hz$^{-1}$]")
ax.set_title(r"Panchromatic AGN+Host SED  ($\log L_{\rm bol} = 46$, $R = 1.5$)")
ax.legend(frameon=False, fontsize=9, ncol=2)
ax.set_xlim(1e-4, 1e6)

fig.tight_layout()
plt.savefig("plot_panchromatic_agn.png", dpi=150, bbox_inches="tight")
plt.show()