Note
Go to the end to download the full example code.
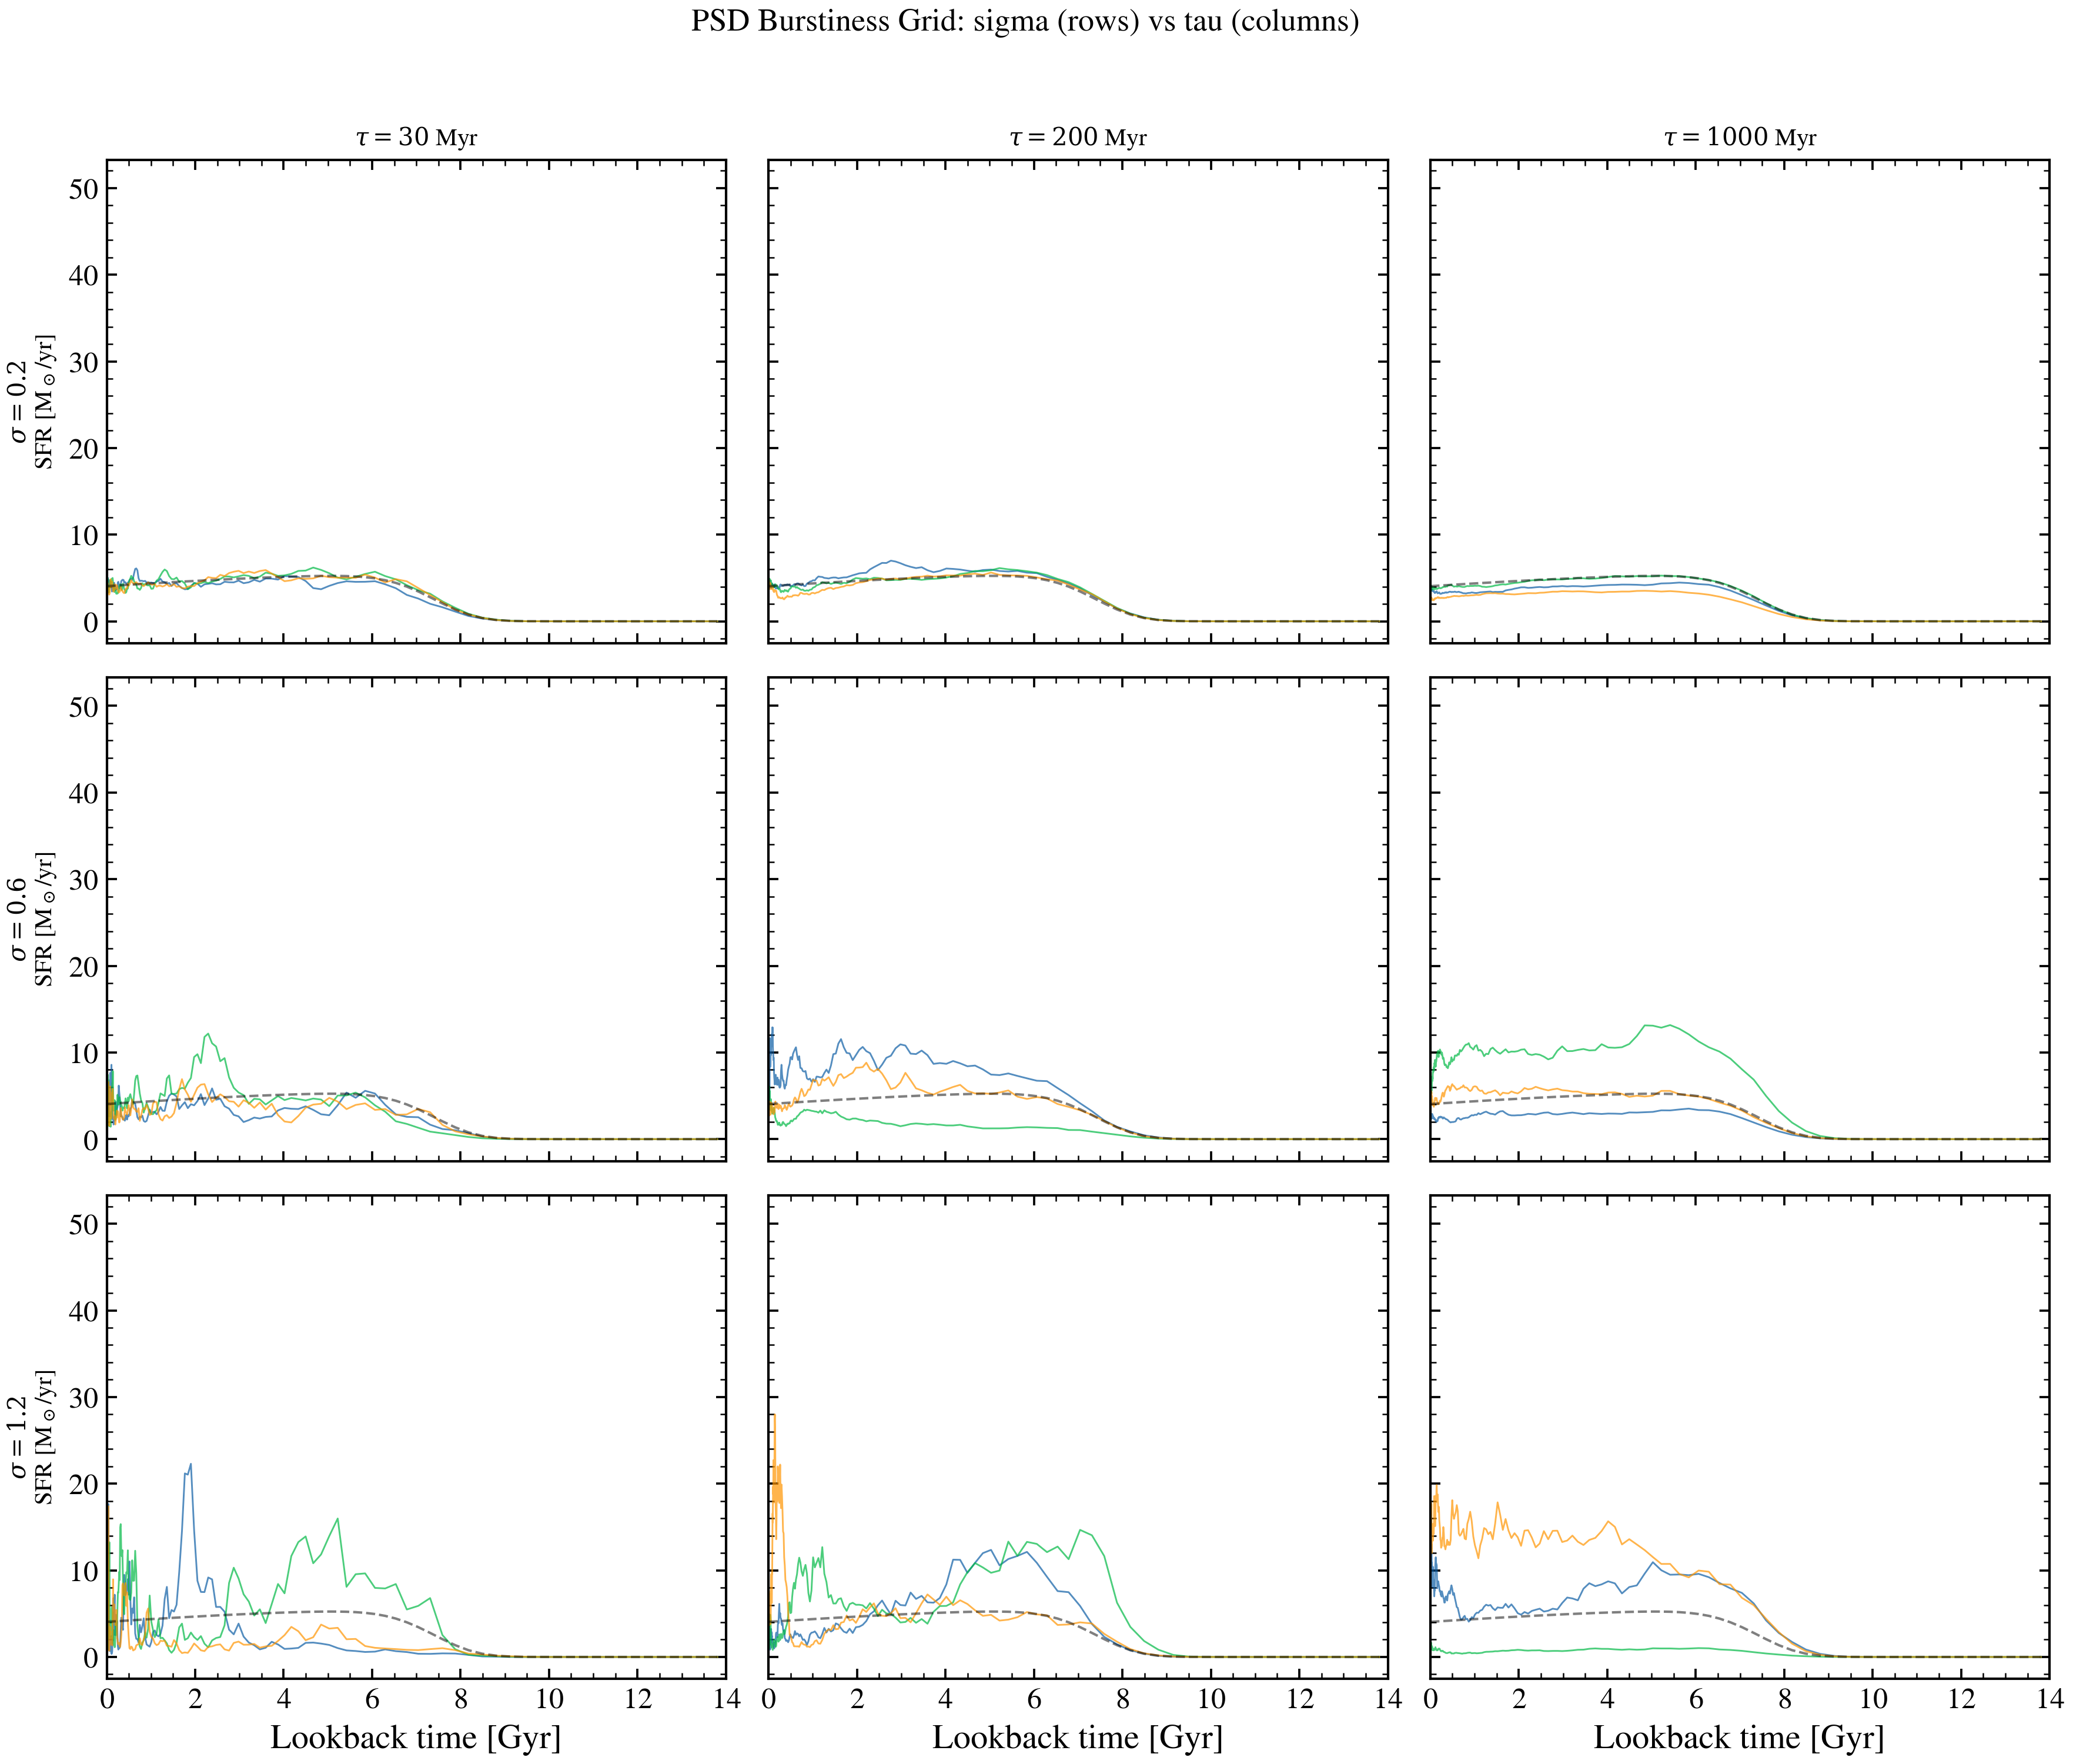
PSD Parameter Space and Burstiness
Visualize how the two DRW PSD parameters – sigma (amplitude) and tau (damping timescale) – map to different levels of SFH burstiness. A 3x3 grid of GP-modulated SFHs shows the effect of each parameter.
import jax
import jax.numpy as jnp
import matplotlib.pyplot as plt
import numpy as np

from tengri import (
    compute_sqrt_power_drw,
    generate_gp_fourier,
    make_log_age_grid,
    tsnorm,
)
from tengri.analysis.plotting import setup_style

setup_style()


# --- Grid setup ---
n_grid = 256
log_age_grid = make_log_age_grid(n_grid)
d_log_age = float(log_age_grid[1] - log_age_grid[0])
t_lookback = 10.0**log_age_grid
t_gyr = np.array(t_lookback) / 1e9

mean_sfr = tsnorm(t_lookback, log_peak_sfr=1.0, peak_lbt=6e9, width=2e9, skew=0.5, trunc=3.0)

# --- Parameter grid ---
sigmas = [0.2, 0.6, 1.2]
taus_myr = [30, 200, 1000]

fig, axes = plt.subplots(3, 3, figsize=(14, 12), sharex=True, sharey=True)
key_base = jax.random.PRNGKey(7)
mean_color = "0.30"
realiz_cmap = plt.get_cmap("viridis")

for i, sigma in enumerate(sigmas):
    for j, tau in enumerate(taus_myr):
        ax = axes[i, j]
        sqrt_p = compute_sqrt_power_drw(n_grid, d_log_age, sigma, tau * 1e6)

        # Plot 5 realizations with a consistent colormap
        n_realiz = 5
        for k in range(n_realiz):
            key = jax.random.fold_in(key_base, i * 100 + j * 10 + k)
            gp = generate_gp_fourier(key, sqrt_p, n_grid)
            variance = float(jnp.var(gp))
            sfr = mean_sfr * jnp.exp(gp - variance / 2.0)
            ax.plot(
                t_gyr,
                np.array(sfr),
                color=realiz_cmap(0.2 + 0.6 * k / max(n_realiz - 1, 1)),
                lw=0.9,
                alpha=0.8,
            )

        # Mean SFH on top so the trend is always visible.
        ax.plot(t_gyr, np.array(mean_sfr), color=mean_color, ls="--", lw=1.4, alpha=0.9)

        ax.set_xlim(0, 14)
        ax.set_yscale("log")
        # Mean peaks at ~5 Msun/yr; sigma=1.2 bursts reach ~30. Give breathing
        # room above and below so the trend reads clearly.
        ax.set_ylim(1e-1, 2e2)

        # Column titles only on the top row, row labels only on the left column.
        if i == 0:
            ax.set_title(rf"$\tau = {tau}$ Myr", fontsize=12)
        if j == 0:
            ax.set_ylabel(
                rf"$\sigma = {sigma}$" "\n" r"SFR [M$_\odot$/yr]",
                fontsize=11,
            )
        if i == 2:
            ax.set_xlabel("Lookback time [Gyr]")

fig.suptitle(
    r"PSD Burstiness Grid: amplitude $\sigma$ (rows) vs damping $\tau$ (columns)",
    fontsize=14,
    y=0.993,
)
fig.tight_layout(rect=[0, 0, 1, 0.96])
plt.savefig("plot_psd_burstiness.png", dpi=150, bbox_inches="tight")
plt.show()