Note
Go to the end to download the full example code.
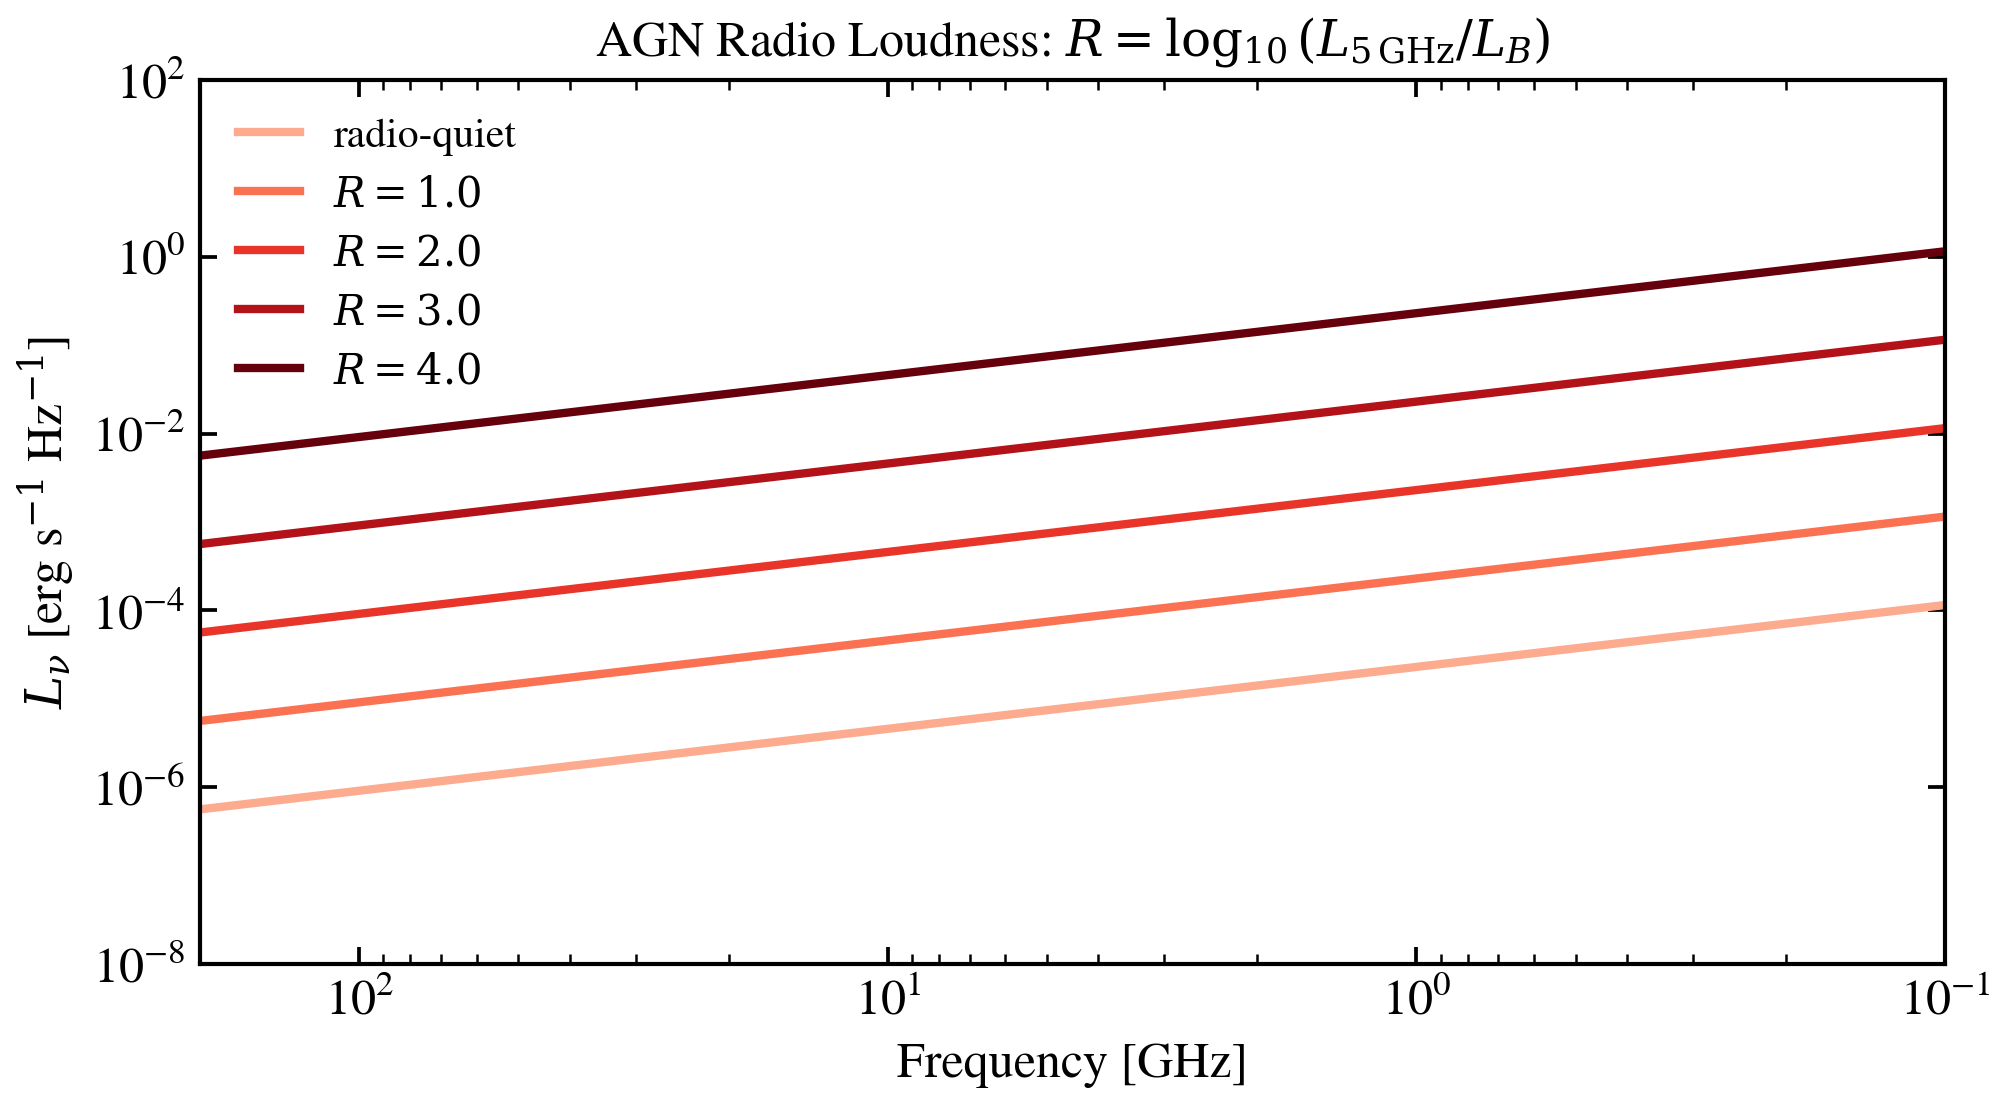
AGN Radio Loudness (R)
Radio loudness \(R = \log_{10}(L_{5\,\rm GHz} / L_B)\) quantifies the ratio of radio to optical AGN luminosity. Radio-quiet AGN have \(R \lesssim 1\); radio-loud AGN (blazars, FR I/II) can reach \(R \sim 3\)–\(5\). Each decade in \(R\) adds an order of magnitude to the jet radio luminosity at fixed bolometric AGN power.
import jax
import jax.numpy as jnp
import matplotlib.pyplot as plt
import numpy as np

jax.config.update("jax_enable_x64", True)

from tengri.analysis.plotting import setup_style
from tengri.radio import radio_agn

setup_style()

wave = jnp.logspace(7, 11, 600)  # 1 mm – 10 m in Angstrom
L_agn_bol = 1e44  # erg/s — Seyfert-1-like bolometric luminosity (in Lsun equivalents)
# Note: radio_agn expects L_agn_bol in the same units as L_nu output (Lsun)
L_agn_bol_lsun = L_agn_bol / 3.828e33  # convert erg/s → Lsun

radio_loudness_values = [0.0, 1.0, 2.0, 3.0, 4.0]
cmap = plt.get_cmap("Reds")
colors = [
    cmap(0.3 + 0.7 * i / max(len(radio_loudness_values) - 1, 1))
    for i in range(len(radio_loudness_values))
]

fig, ax = plt.subplots(figsize=(7, 4))

for R, color in zip(radio_loudness_values, colors):
    L_nu = radio_agn(wave, L_agn_bol=L_agn_bol_lsun, radio_loudness=R, alpha_agn=0.7)
    nu_ghz = (3e18 / np.array(wave)) / 1e9
    label = "radio-quiet" if R == 0 else rf"$R={R}$"
    ax.loglog(nu_ghz, np.array(L_nu), color=color, lw=2.0, label=label)

ax.set_xlabel("Frequency [GHz]", fontsize=12)
ax.set_ylabel(r"$L_\nu$ [erg s$^{-1}$ Hz$^{-1}$]", fontsize=12)
ax.invert_xaxis()
ax.set_xlim(200, 0.1)
ax.set_ylim(1e-8, 1e2)
ax.legend(fontsize=10, frameon=False)
ax.set_title(r"AGN Radio Loudness: $R = \log_{10}(L_{5\,\mathrm{GHz}} / L_B)$", fontsize=12)
plt.tight_layout()
plt.savefig("plot_radio_loudness_sweep.png", dpi=150, bbox_inches="tight")
plt.show()