Note
Go to the end to download the full example code.
UV slope β degeneracy: dust optical depth and stellar age
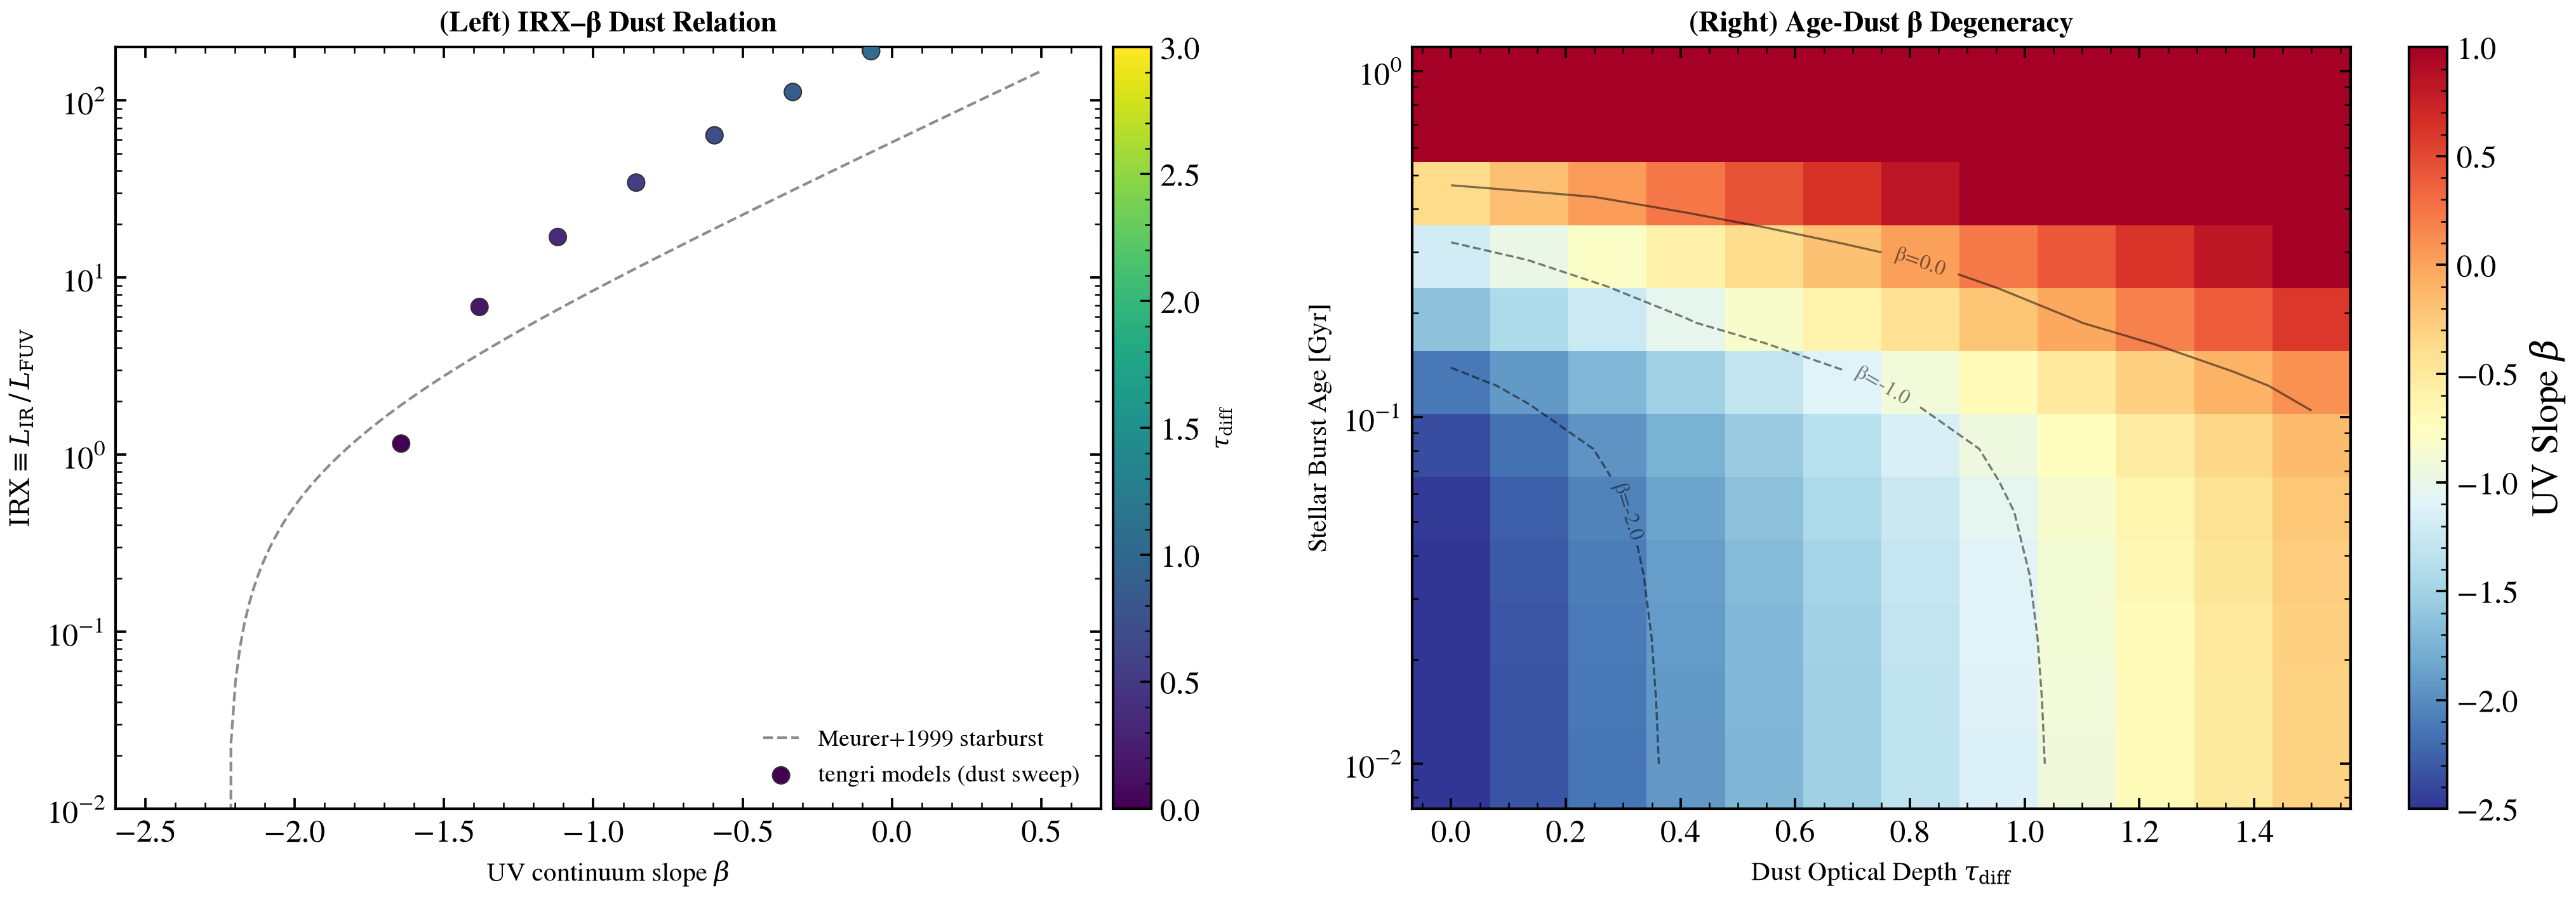
The infrared excess (IRX = L_IR / L_FUV) versus UV-continuum slope β diagram is the standard tool for inferring attenuation in star-forming galaxies. However, β is degenerate between dust and stellar age: young dusty and old dust-free populations both exhibit red UV continua.
Left panel: IRX–β relation under dust sweep. Mock star-forming galaxies with fixed SFH, varying dust optical depth (τ_diff ∈ [0, 3.0]), measure β by fitting rest-frame UV continuum (1268–2580 Å, Calzetti+1994 windows), and overplot the empirical Meurer+1999 starburst relation. Shows how dust traces the main IRX–β correlation.
Right panel: Age-dust β degeneracy via 2D heatmap. Simultaneously vary stellar age (t_burst ∈ [0.01, 1.0] Gyr) and dust optical depth (τ_diff ∈ [0, 1.5]) on a single-burst SFH. Both axes reddened the UV, demonstrating that β alone cannot distinguish whether a red continuum is young+dusty or old+dustless. Iso-β contours reveal the degenerate directions.
References:
Meurer, Heckman & Calzetti 1999, ApJ, 521, 64 (starburst IRX–β relation)
Calzetti, Kinney & Storchi-Bergmann 1994, ApJ, 429, 582 (UV slope fitting windows)
/tengri/src/tengri/forward/sed_model.py:13787: SFHBeyondOldestTemplateWarning: The SSP grid's oldest template is 12.589 Gyr but the universe is 13.787 Gyr old at redshift 0. Stars formed in that gap are older than every template, so both age kernels assign them to the oldest one: the formed mass is conserved, and those stars carry the colors of a 12.589 Gyr population. Use a grid whose oldest template reaches 13.787 Gyr (e.g. MIST) to remove the approximation.
  return cls(
/tengri/src/tengri/forward/sed_model.py:13787: SFHBeyondOldestTemplateWarning: The SSP grid's oldest template is 12.589 Gyr but the universe is 13.643 Gyr old at redshift 0.01. Stars formed in that gap are older than every template, so both age kernels assign them to the oldest one: the formed mass is conserved, and those stars carry the colors of a 12.589 Gyr population. Use a grid whose oldest template reaches 13.643 Gyr (e.g. MIST) to remove the approximation.
  return cls(
import os

os.environ["TF_CPP_MIN_LOG_LEVEL"] = "2"  # suppress XLA/PjRt C++ INFO+WARNING logs

import warnings

import jax
import jax.numpy as jnp
import matplotlib.pyplot as plt
import numpy as np

import tengri
from tengri.plot import setup_style

setup_style()
warnings.filterwarnings("ignore", message=".*BakedInBackend.*")


C_AA_PER_S = 2.998e18

# Calzetti+1994 windows for fitting the UV slope: pairs of (lam_lo, lam_hi)
# in Å. β is the slope of f_λ ∝ λ^β fit through the windows.
CAL94_WINDOWS = np.array(
    [
        [1268, 1284],
        [1309, 1316],
        [1342, 1371],
        [1407, 1515],
        [1562, 1583],
        [1677, 1740],
        [1760, 1833],
        [1866, 1890],
        [1930, 1950],
        [2400, 2580],
    ]
)


def _measure_beta(wave_aa: np.ndarray, l_nu: np.ndarray) -> float:
    """Return Calzetti+1994 UV slope β from f_λ ∝ λ^β."""
    f_lam = l_nu * C_AA_PER_S / wave_aa**2  # L_λ ∝ L_ν / λ^2
    mask = np.zeros_like(wave_aa, dtype=bool)
    for lo, hi in CAL94_WINDOWS:
        mask |= (wave_aa >= lo) & (wave_aa <= hi)
    x = np.log10(wave_aa[mask])
    y = np.log10(f_lam[mask])
    slope, _ = np.polyfit(x, y, 1)
    return float(slope)


def _bolometric_lir(wave_aa: np.ndarray, l_nu: np.ndarray) -> float:
    """Integrate L_ν from 8–1000 μm to obtain L_IR [erg s⁻¹]."""
    mask = (wave_aa >= 8.0e4) & (wave_aa <= 1.0e7)
    nu = C_AA_PER_S / wave_aa[mask]
    order = np.argsort(nu)
    return float(np.trapezoid(l_nu[mask][order], nu[order]))


def _lfuv(wave_aa: np.ndarray, l_nu: np.ndarray) -> float:
    """ν L_ν at the FUV (1600 Å) — proxy for unattenuated FUV power."""
    i = int(np.argmin(np.abs(wave_aa - 1600.0)))
    return float(C_AA_PER_S / wave_aa[i] * l_nu[i])


ssp = tengri.load_ssp()

# ==============================================================================
# LEFT PANEL: IRX–β relation (dust sweep)
# ==============================================================================

model_dust_sweep = tengri.SEDModel.build(
    ssp,
    sfh={
        "type": "dpl",
        "all_params": tengri.Fixed(tengri.DEFAULT),
        "alpha": 2.0,
        "beta": 2.5,
        "tau_gyr": 0.5,  # young starburst -> strong UV
        "log_total_mass": 10.0,
    },
    dust_attenuation={
        "law": "power_law",
        "type": "two_component",
        "all_params": tengri.Fixed(tengri.DEFAULT),
        "tau_diff": tengri.Uniform(0.0, 4.0),
        "tau_bc": 0.5,
        "slope": -0.7,
    },
    dust_emission={"type": "dale2014", "all_params": tengri.Fixed(tengri.DEFAULT)},
    redshift=tengri.Fixed(0.0),
)
baseline_dust_sweep = dict(model_dust_sweep.spec.sample(jax.random.PRNGKey(0)))

tau_grid = np.linspace(0.0, 3.0, 18)
beta_arr = np.empty_like(tau_grid)
irx_arr = np.empty_like(tau_grid)

for i, tau in enumerate(tau_grid):
    out = model_dust_sweep.predict({**baseline_dust_sweep, "dust_tau_diff": jnp.float64(tau)})
    wave = np.asarray(model_dust_sweep.wavelengths)
    l_nu = np.asarray(out.rest_sed())
    beta_arr[i] = _measure_beta(wave, l_nu)
    irx_arr[i] = _bolometric_lir(wave, l_nu) / _lfuv(wave, l_nu)

# ==============================================================================
# RIGHT PANEL: Age-dust degeneracy via 2D heatmap
# ==============================================================================


def _beta_uv(wave, l_nu):
    """Compute UV slope β where F_λ ∝ λ^β using Calzetti+1994 windows."""
    f_lam = l_nu * C_AA_PER_S / wave**2
    mask = np.zeros_like(wave, dtype=bool)
    for lo, hi in CAL94_WINDOWS:
        mask |= (wave >= lo) & (wave <= hi)
    if mask.sum() < 2:
        return np.nan
    slope, _ = np.polyfit(np.log10(wave[mask]), np.log10(f_lam[mask]), 1)
    return float(slope)


# Build model with fixed peak_lbt_frac and dust parameters, then override during sampling
model_age_dust = tengri.SEDModel.build(
    ssp,
    sfh={
        "type": "tsnorm",
        "all_params": tengri.Fixed(tengri.DEFAULT),
        "peak_lbt_frac": tengri.FREE,
        "width_gyr": 0.05,
        "log_total_mass": 10.0,
        "skew": 0.0,
        "trunc": 1.0,
    },
    dust_attenuation={
        "law": "power_law",
        "type": "two_component",
        "all_params": tengri.Fixed(tengri.DEFAULT),
        "tau_diff": tengri.FREE,
        "tau_bc": 0.0,
    },
    redshift=tengri.Fixed(0.01),
)

baseline_age_dust = dict(model_age_dust.spec.sample(jax.random.PRNGKey(0)))
AGE_Z = float(tengri.cosmology.age_at_z(0.01))  # Gyr

# 2D sweep: age × dust (limited range to avoid IR artifacts)
age_values = np.logspace(np.log10(0.01), np.log10(1.0), 12)
tau_values = np.linspace(0.0, 1.5, 12)

beta_2d = np.zeros((len(age_values), len(tau_values)))

for age_idx, age in enumerate(age_values):
    for tau_idx, tau in enumerate(tau_values):
        p = {
            **baseline_age_dust,
            "sfh_tsnorm_peak_lbt_frac": jnp.float64(age / AGE_Z),
            "dust_tau_diff": jnp.float64(tau),
        }
        out = model_age_dust.predict(p)
        beta_2d[age_idx, tau_idx] = _beta_uv(
            np.asarray(model_age_dust.wavelengths), np.asarray(out.rest_sed())
        )

# ==============================================================================
# Create two-panel figure
# ==============================================================================

fig, (ax_left, ax_right) = plt.subplots(1, 2, figsize=(14.0, 5.0))

# LEFT: IRX–β relation (dust sweep)
# Meurer+1999 starburst relation: log10 IRX = log10(10^(0.4*(4.43+1.99*beta)) - 1)
beta_emp = np.linspace(-2.5, 0.5, 200)
A_FUV_meurer = 4.43 + 1.99 * beta_emp
irx_meurer = 10 ** (0.4 * A_FUV_meurer) - 1.0

ax_left.plot(beta_emp, irx_meurer, color="0.55", lw=1.0, ls="--", label="Meurer+1999 starburst")
sc = ax_left.scatter(
    beta_arr,
    irx_arr,
    c=tau_grid,
    cmap="viridis",
    s=42,
    lw=0.5,
    edgecolor="0.2",
    zorder=3,
    label="tengri models (dust sweep)",
)
ax_left.set_yscale("log")
ax_left.set_xlim(-2.6, 0.7)
ax_left.set_ylim(1e-2, 2e2)
ax_left.set_xlabel(r"UV continuum slope $\beta$", fontsize=10)
ax_left.set_ylabel(r"$\mathrm{IRX} \equiv L_{\rm IR}\,/\,L_{\rm FUV}$", fontsize=10)
ax_left.legend(frameon=False, fontsize=9, loc="lower right")
ax_left.set_title("(Left) IRX–β Dust Relation", fontweight="bold", fontsize=11)
cbar = fig.colorbar(sc, ax=ax_left, pad=0.01)
cbar.set_label(r"$\tau_{\rm diff}$", fontsize=9)

# RIGHT: Age-dust degeneracy heatmap
im = ax_right.pcolormesh(
    tau_values,
    age_values,
    beta_2d,
    shading="auto",
    cmap="RdYlBu_r",
    vmin=-2.5,
    vmax=1.0,
)

ax_right.set_xlabel(r"Dust Optical Depth $\tau_{\rm diff}$", fontsize=10)
ax_right.set_ylabel(r"Stellar Burst Age [Gyr]", fontsize=10)
ax_right.set_yscale("log")
ax_right.set_title("(Right) Age-Dust β Degeneracy", fontweight="bold", fontsize=11)

cbar_right = plt.colorbar(im, ax=ax_right, label=r"UV Slope $\beta$")

# Add contours for key β values
levels = [-2.0, -1.0, 0.0]
contours = ax_right.contour(
    tau_values, age_values, beta_2d, levels=levels, colors="black", linewidths=0.8, alpha=0.5
)
ax_right.clabel(contours, inline=True, fontsize=8, fmt="β=%.1f")

fig.tight_layout()
plt.savefig("plot_usecase_uv_slope_beta.png", dpi=150, bbox_inches="tight")
Total running time of the script: (0 minutes 32.085 seconds)