Note
Go to the end to download the full example code.
Predicting SEDs for a simulated population: what collapsing Z(t) costs
Replacing metallicity history Z(t) with its mass-weighted mean introduces 10–23% flux errors in u and 1–6% in z. The SED is a nonlinear mass-weighted sum of SSP templates; young metal-rich stars (dominant in UV) and old metal-poor stars do not average.
Reference: Conroy+2013.
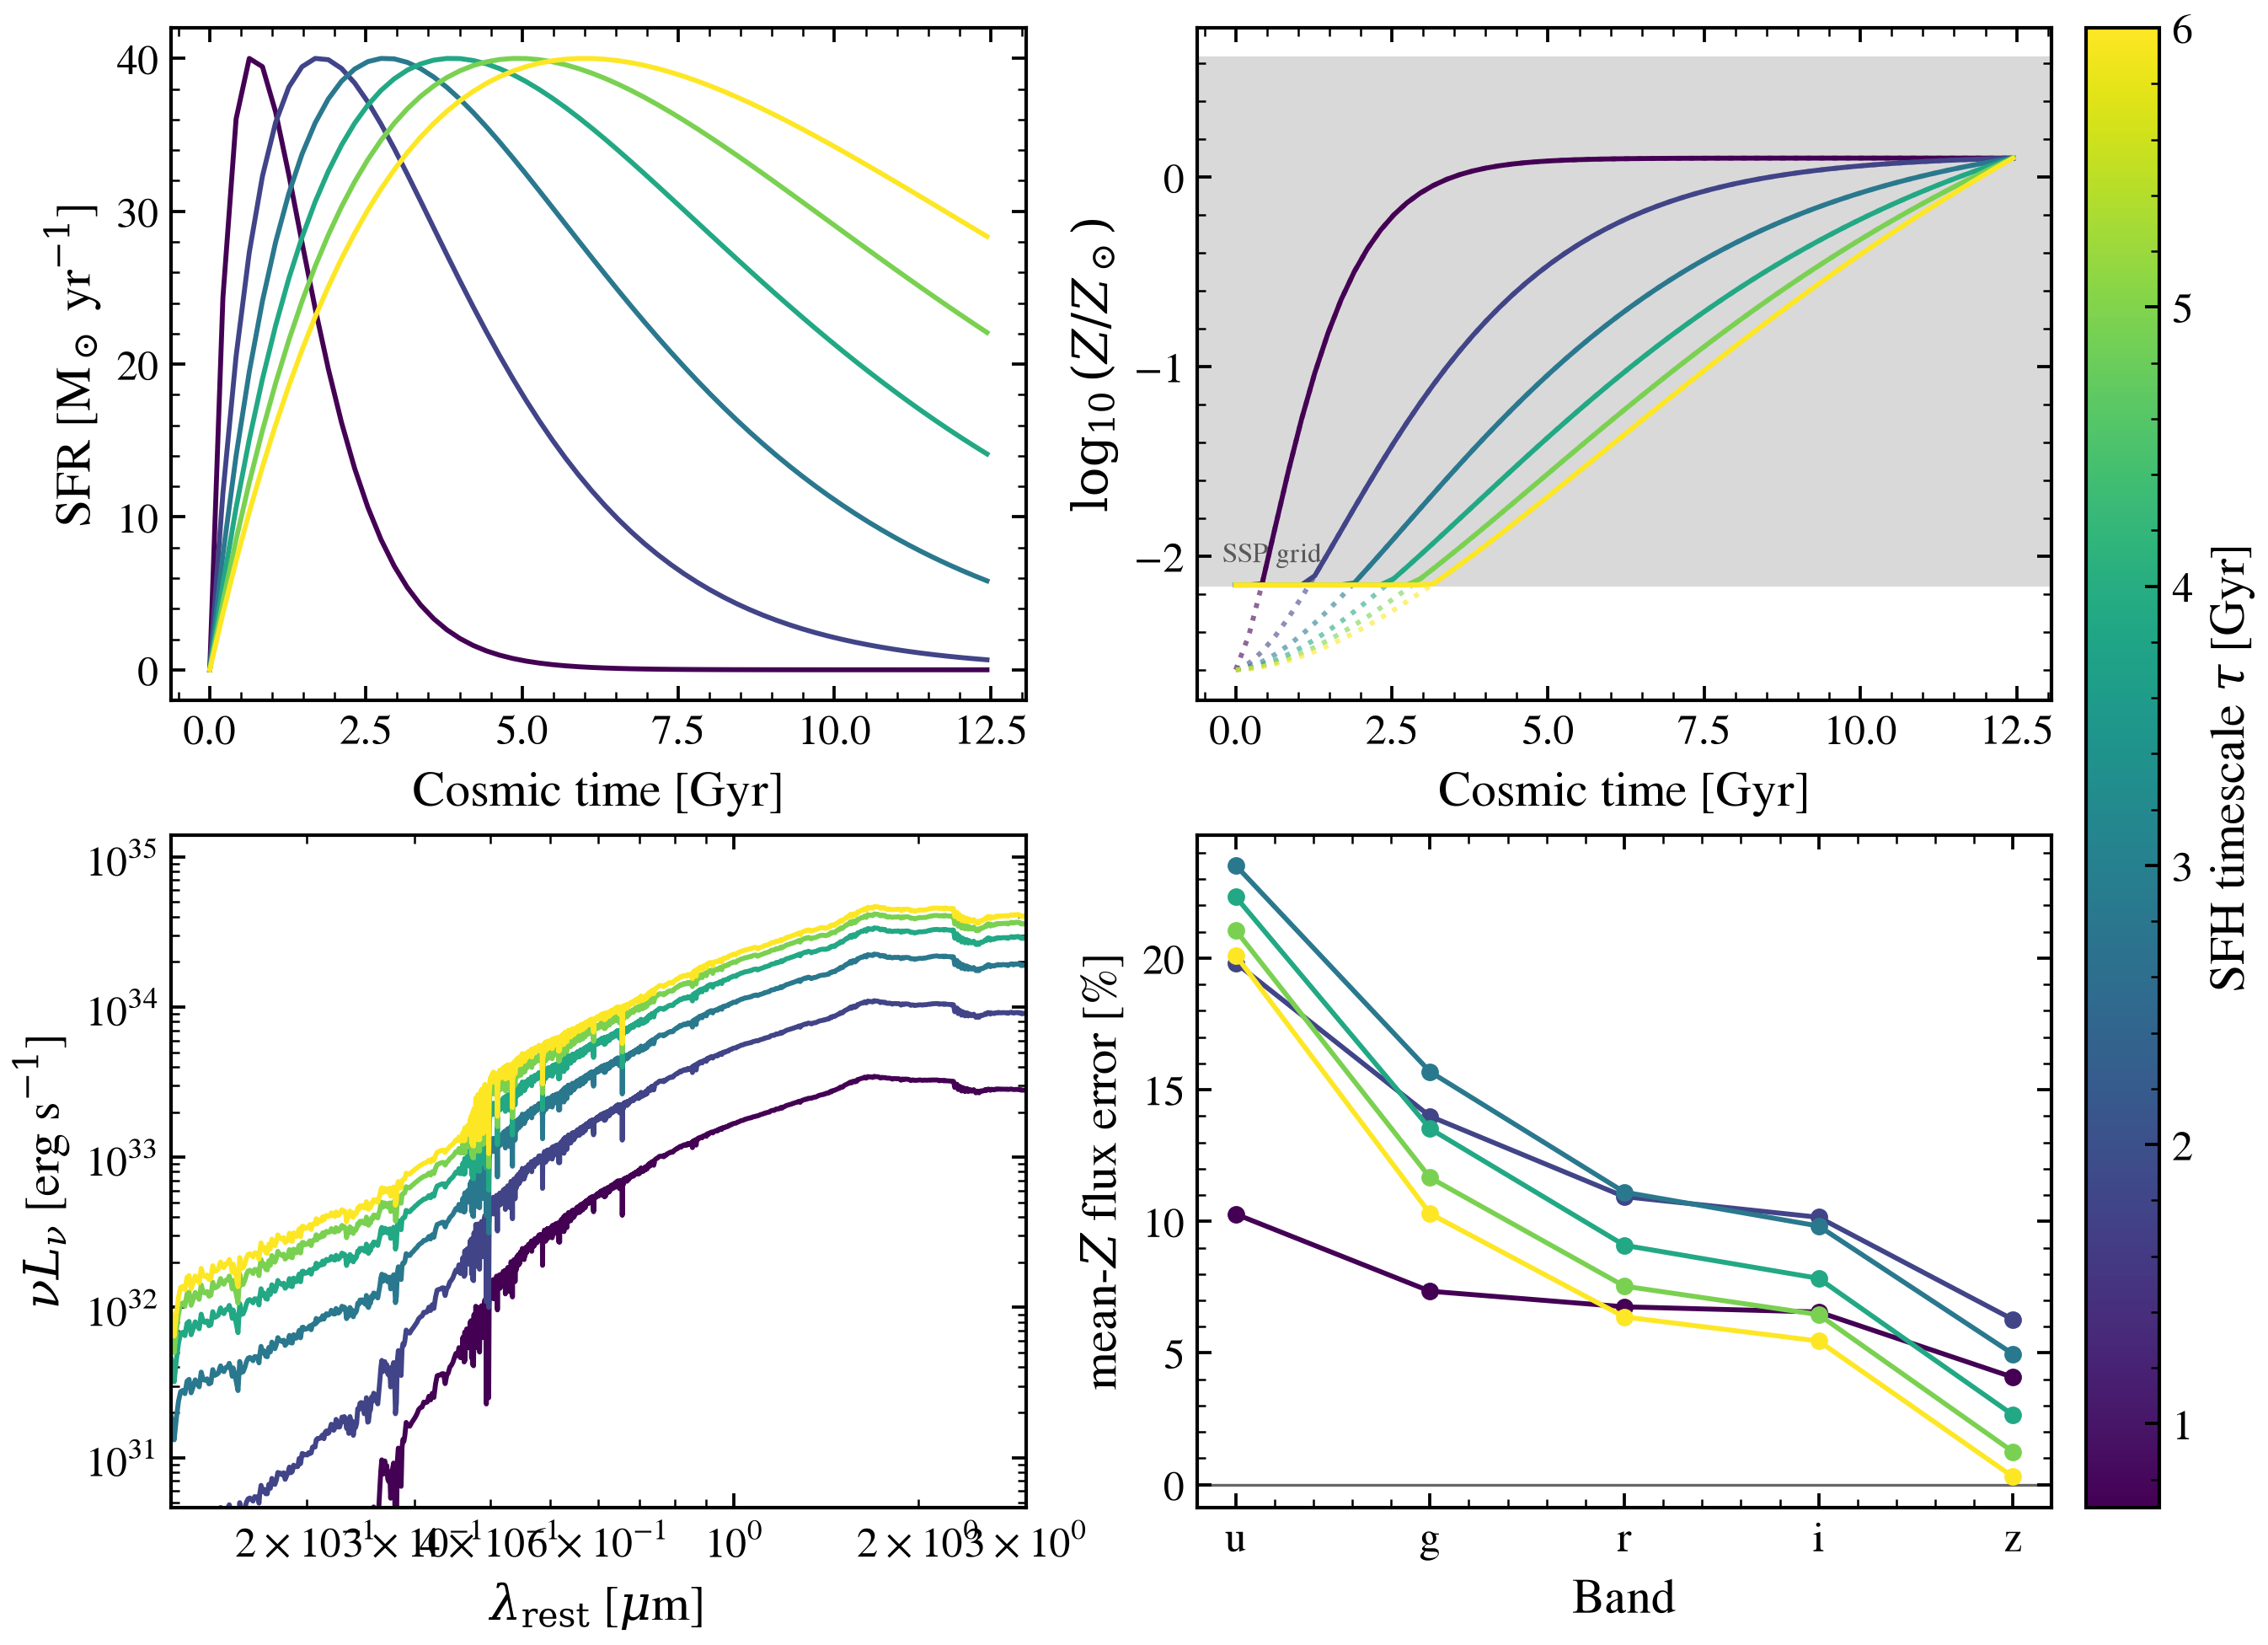
/tengri/examples/usecases/plot_usecase_simulation_seds.py:65: DefaultFixedParametersWarning: Group 'met' states no 'all_params' disposition, so its remaining parameter was fixed at declared defaults:
  met_alpha_fe=0

To fit them, pass 'all_params': FREE:
  met={'all_params': FREE, ...}
To keep them fixed and silence this warning, say so explicitly:
  met={'all_params': Fixed(DEFAULT), ...}
  model_zt = tengri.SEDModel.build(
/tengri/src/tengri/forward/sed_model.py:13820: YoungTopMetallicityWarning: met_logzsol reaches Z = 0.1197 (its upper bound, Z = 0.0600, plus 3 x the metallicity-scatter upper bound of 0.1 dex that the scatter kernel spans), above Z = 0.0497, where the metallicity weights start to use the Z = 0.0600 node of this SSP grid (its highest complete node is Z = 0.0400). The Z = 0.0600 node has no stars above ~12 Msun for log10(age/yr) <= 7.15: FSPS ISOCHRONES/PARSEC/isoc_z0.0600.dat: Mini capped at 12.01 Msun for every log age 5.50-7.15 (343 rows at 5.50; isoc_z0.0200.dat reaches 300 Msun); the PARSEC massive-star tracks stop at Z = 0.04 (Chen et al. 2015, MNRAS 452, 1068). The metallicity is therefore held at Z = 0.0400 for log10(age/yr) <= 7.15, and the top node's weight rises linearly with log age to 1 at 7.20; older populations use the top node unchanged. To use a MIST [Z/H] = +0.5 node (FSPS zlegend Z = 0.0449) at young ages instead, load the grid with top_z='mist': tengri.load_ssp(<name>, top_z='mist') or load_ssp_data(<path>, top_z='mist'). That node has MIST isochrones, so between Z = 0.0400 and 0.0449 the young population switches isochrone physics, not only metallicity.
  return cls(
import os

os.environ["TF_CPP_MIN_LOG_LEVEL"] = "2"  # suppress XLA/PjRt C++ INFO+WARNING logs

import warnings

import matplotlib as mpl
import matplotlib.pyplot as plt
import numpy as np

import tengri
from tengri.plot import setup_style
from tengri.units import LOG10_ZSUN
from tengri.utils.cosmology import age_at_z

setup_style()
warnings.filterwarnings("ignore", message=".*BakedInBackend.*")

ssp = tengri.load_ssp()
bands = ["sdss_u", "sdss_g", "sdss_r", "sdss_i", "sdss_z"]
obs = tengri.Observation(photometry=tengri.Photometry.from_names(bands))

Z_OBS = 0.1
N_GAL, N_T = 6, 60
# The history ends at the age of the universe at the observed redshift: SFR
# after that time cannot reach the observer, and from_histories refuses it.
t_gyr = np.linspace(0.0, float(age_at_z(Z_OBS)), N_T)

# Stand-in for a snapshot's merger-tree histories: delayed-tau SFHs whose
# formation timescale varies across the population, from a fast early-forming
# galaxy to one still rising today.
tau_gyr = np.linspace(0.7, 6.0, N_GAL)
sfr = (t_gyr[None, :] / tau_gyr[:, None]) * np.exp(-t_gyr[None, :] / tau_gyr[:, None])
sfr *= 40.0 / sfr.max(axis=1, keepdims=True)

# Closed-box-flavored enrichment: metallicity tracks the cumulative mass formed,
# so a fast-forming galaxy reaches solar early and a slow one is still metal-poor.
cumulative = np.cumsum(sfr, axis=1)
cumulative /= cumulative[:, -1:]
logzsol = -2.6 + 2.7 * cumulative

# The SSP's grid is a hard limit on what the templates can represent, and the
# lookup clips onto it silently. Simulations reach primordial metallicity at
# early times as a matter of course, so this clip is the ordinary case — done
# here explicitly, because from_histories refuses an off-grid history by default
# rather than let the clamp happen out of sight (#1677).
grid_lo = float(np.min(ssp.ssp_lgmet)) - LOG10_ZSUN
grid_hi = float(np.max(ssp.ssp_lgmet)) - LOG10_ZSUN
logzsol_clipped = np.clip(logzsol, grid_lo, grid_hi)

params = {"dust_tau_diff": np.full(N_GAL, 0.25)}

model_zt = tengri.SEDModel.build(
    ssp,
    observation=obs,
    sfh={"type": "table"},
    met={"type": "table"},
    dust_attenuation={
        "law": "power_law",
        "type": "two_component",
        "all_params": tengri.Fixed(tengri.DEFAULT),
        "tau_bc": 0.4,
        "tau_diff": tengri.FREE,
    },
    redshift=tengri.Fixed(Z_OBS),
)
fwd_zt = tengri.ForwardModel.build(sed=model_zt, observation=obs)
flux_zt = np.asarray(
    tengri.Catalog.from_histories(
        fwd_zt, t_gyr=t_gyr, sfr=sfr, met=logzsol_clipped, params=params
    ).predict()
)

# The approximation under test: one metallicity per galaxy, weighted by the mass
# each node formed — the fairest single number the history can be reduced to.
weights = sfr * np.gradient(t_gyr)[None, :]
mean_logzsol = (weights * logzsol_clipped).sum(axis=1) / weights.sum(axis=1)

model_mean = tengri.SEDModel.build(
    ssp,
    observation=obs,
    sfh={"type": "table"},
    met={"logzsol": tengri.Uniform(grid_lo, grid_hi)},
    dust_attenuation={
        "law": "power_law",
        "type": "two_component",
        "all_params": tengri.Fixed(tengri.DEFAULT),
        "tau_bc": 0.4,
        "tau_diff": tengri.FREE,
    },
    redshift=tengri.Fixed(Z_OBS),
)
fwd_mean = tengri.ForwardModel.build(sed=model_mean, observation=obs)
flux_mean = np.asarray(
    tengri.Catalog.from_histories(
        fwd_mean,
        t_gyr=t_gyr,
        sfr=sfr,
        params={**params, "met_logzsol": mean_logzsol},
    ).predict()
)

fig, axes = plt.subplots(2, 2, figsize=(11.5, 7.6))
cmap = plt.get_cmap("viridis")
norm = mpl.colors.Normalize(vmin=tau_gyr.min(), vmax=tau_gyr.max())
colors = [cmap(norm(t)) for t in tau_gyr]

ax = axes[0, 0]
for i, c in enumerate(colors):
    ax.plot(t_gyr, sfr[i], color=c, lw=1.4)
ax.set(xlabel="Cosmic time [Gyr]", ylabel=r"SFR [M$_\odot$ yr$^{-1}$]")

ax = axes[0, 1]
ax.axhspan(grid_lo, grid_hi, color="0.85", zorder=0)
for i, c in enumerate(colors):
    ax.plot(t_gyr, logzsol[i], color=c, lw=1.4, ls=":", alpha=0.6)
    ax.plot(t_gyr, logzsol_clipped[i], color=c, lw=1.4)
ax.annotate(
    "SSP grid",
    xy=(0.03, grid_lo + 0.12),
    xycoords=("axes fraction", "data"),
    fontsize=8,
    color="0.35",
)
# Dotted below the band is the unclipped track; the grid floor is where the
# templates stop, not where the physics does.
ax.set(xlabel="Cosmic time [Gyr]", ylabel=r"$\log_{10}(Z/Z_\odot)$")

ax = axes[1, 0]
XLIM_UM = (0.12, 3.0)  # the span the ugriz bands sample at z=0.1, plus context
peak = 0.0
for i, c in enumerate(colors):
    pred = model_zt.predict(
        {
            "dust_tau_diff": 0.25,
            "sfh_t_gyr": t_gyr,
            "sfh_sfr": sfr[i],
            "met_history": logzsol_clipped[i],
        }
    )
    wave = np.asarray(pred.wave_rest)
    nu_lnu = wave * np.asarray(pred.rest_sed())
    ax.loglog(wave / 1e4, nu_lnu, color=c, lw=1.4)
    inside = (wave / 1e4 >= XLIM_UM[0]) & (wave / 1e4 <= XLIM_UM[1])
    peak = max(peak, float(nu_lnu[inside].max()))
# Four decades below the brightest curve: the early-quenched galaxy's UV falls
# ~20 dex, which would flatten every other curve into a line if left in frame.
ax.set(
    xlabel=r"$\lambda_{\rm rest}$ [$\mu$m]",
    ylabel=r"$\nu L_\nu$ [erg s$^{-1}$]",
    xlim=XLIM_UM,
    ylim=(peak / 1e4, peak * 3.0),
)

ax = axes[1, 1]
residual = 100.0 * (flux_mean / flux_zt - 1.0)
x = np.arange(len(bands))
for i, c in enumerate(colors):
    ax.plot(x, residual[i], color=c, lw=1.4, marker="o", ms=4)
ax.axhline(0.0, color="0.4", lw=0.8, zorder=0)
ax.set(
    xticks=x,
    xlabel="Band",
    ylabel=r"mean-$Z$ flux error [%]",
)
ax.set_xticklabels([b.split("_")[-1] for b in bands])

cbar = fig.colorbar(
    plt.cm.ScalarMappable(norm=norm, cmap=cmap),
    ax=axes,
    pad=0.015,
    label=r"SFH timescale $\tau$ [Gyr]",
)

fig.savefig("plot_workflow_simulation_seds.png", dpi=150, bbox_inches="tight")
Total running time of the script: (0 minutes 17.123 seconds)