Note
Go to the end to download the full example code.
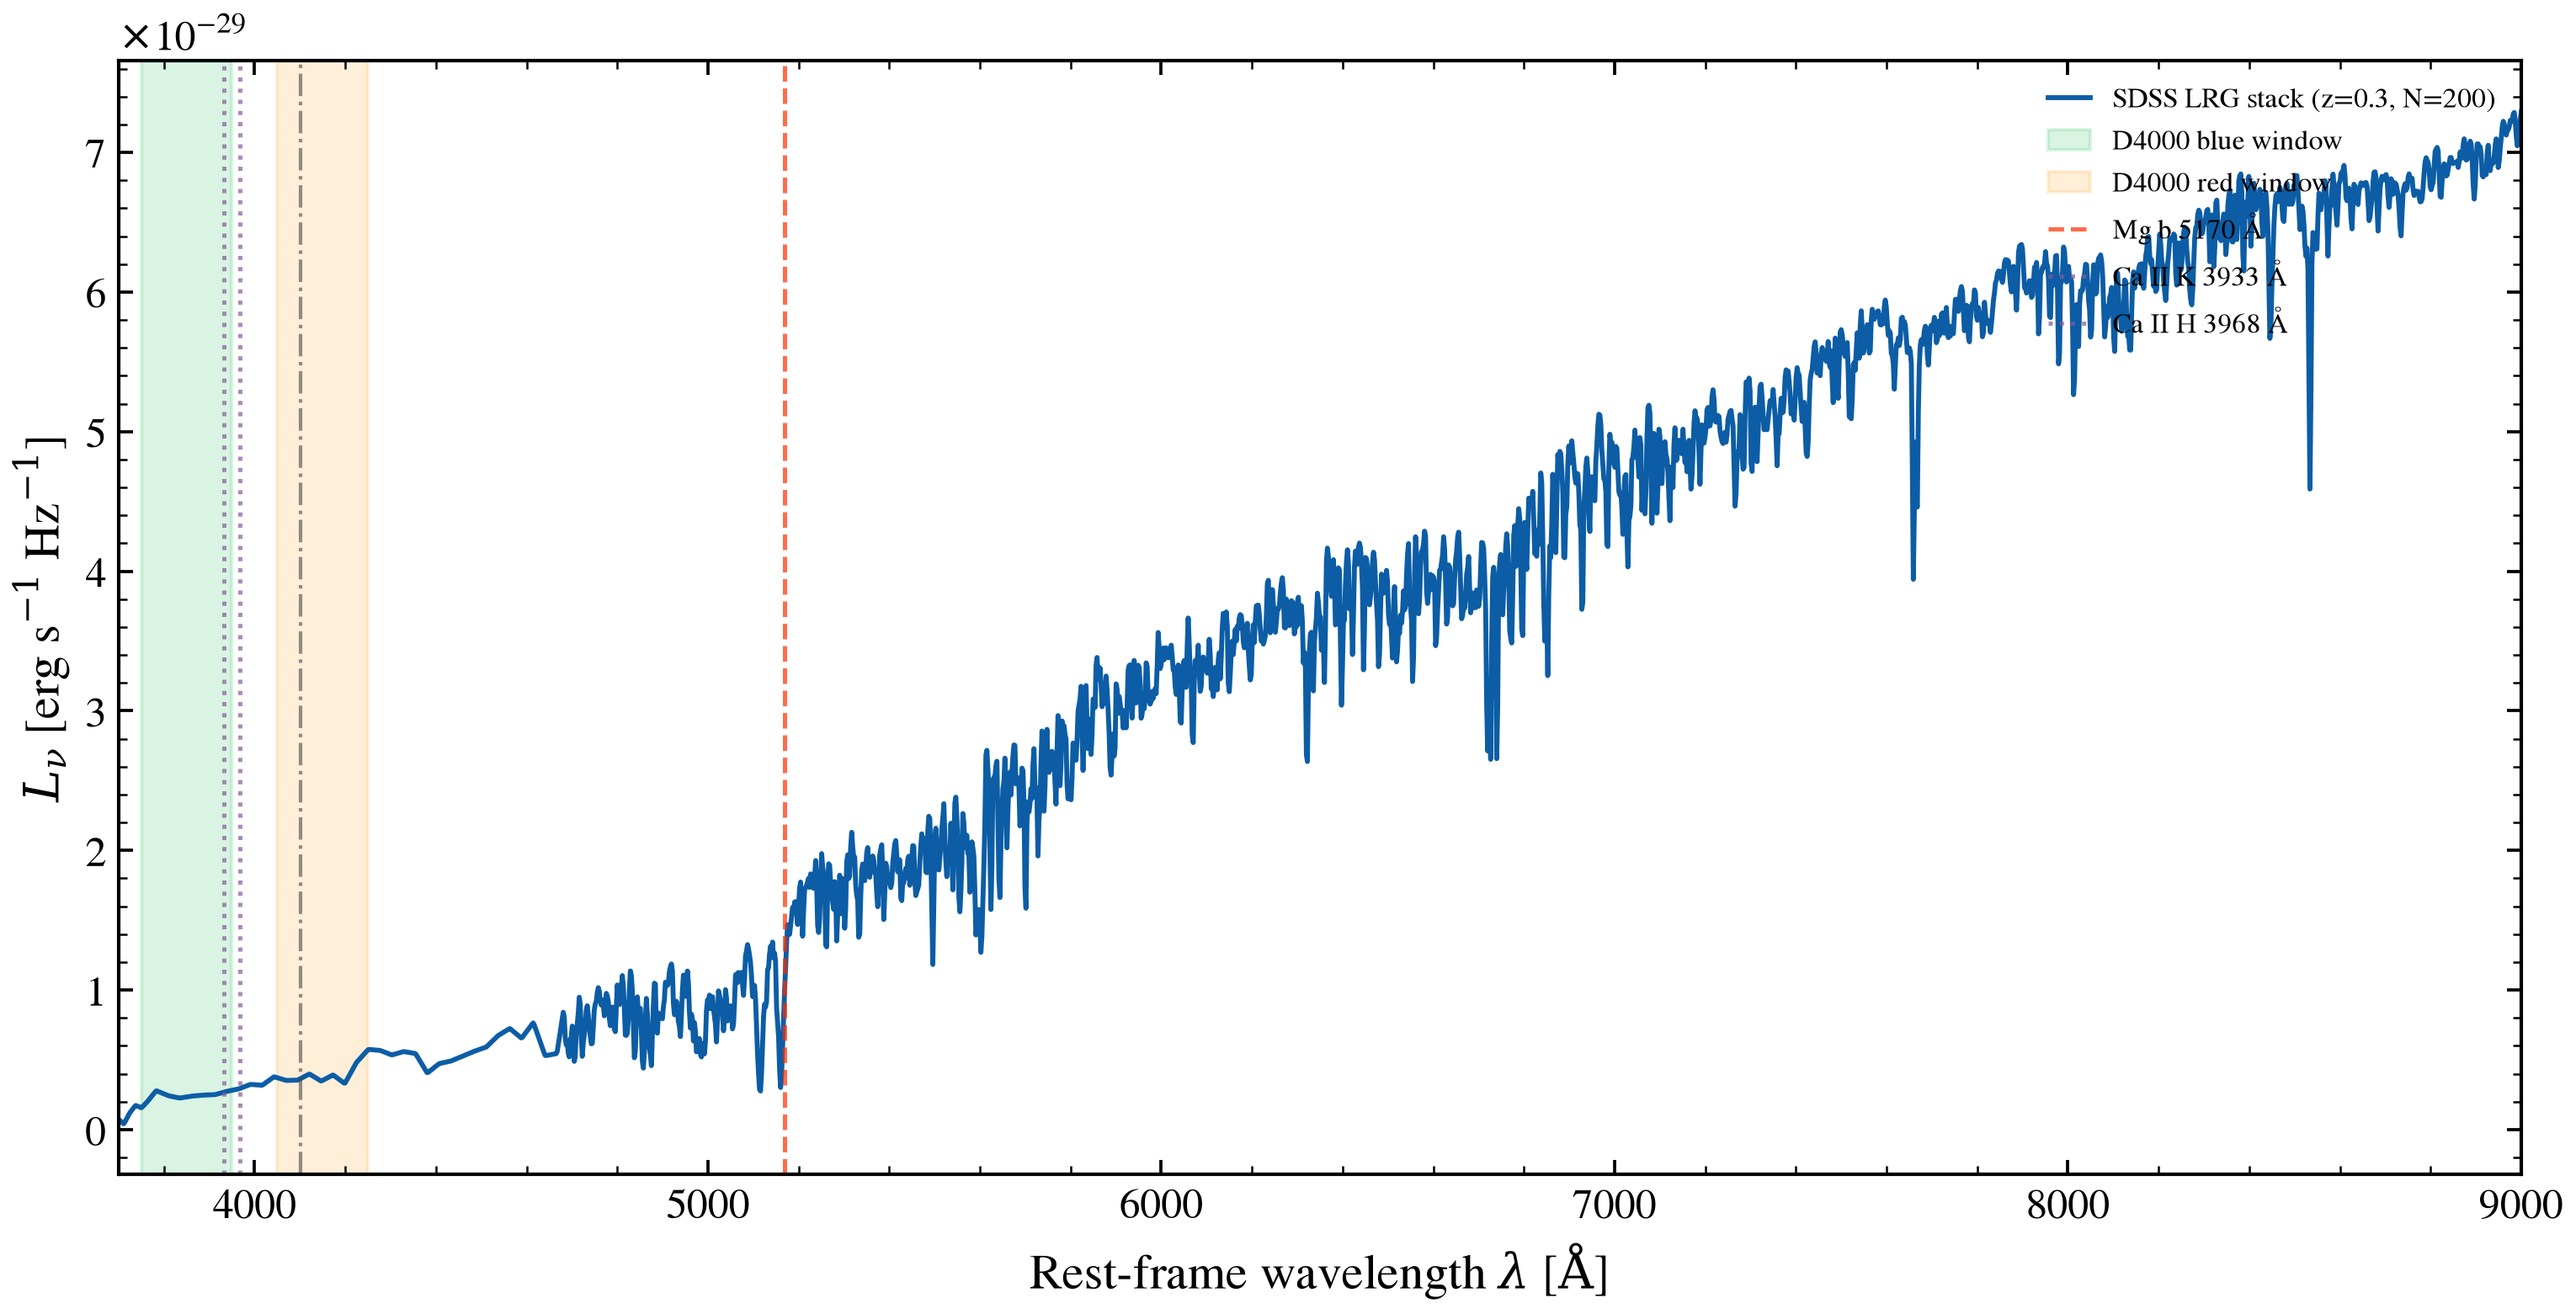
SDSS Luminous Red Galaxy Stacked Template Spectrum
Build a population of N=200 quiescent galaxies replicating the SDSS Luminous Red Galaxy (LRG) sample selection (Eisenstein et al. 2001, SDSS-I): old, massive systems at z~0.3 with log M* ≈ 11 and ages sampling the red-sequence range Uniform(6, 11) Gyr (Thomas et al. 2005).
Stack their rest-frame spectra at R=2000 (3700–9000 Å) to produce a median composite that shows the D4000 break, Mg b 5170 Å absorption feature, and Ca II H+K lines characteristic of quiescent early-type galaxies.
Key techniques:
Build tengri models with simple quiescent SFH (narrow tsnorm)
Use jax.vmap to batch-predict N spectra in parallel
Stack with simple median-flux combination
Label age-sensitive features (D4000, Mg b, Ca II H+K)
References:
Eisenstein et al. 2001, AJ, 122, 2267 (SDSS LRG selection)
Thomas et al. 2005, ApJ, 621, 673 (red-sequence ages)
/tengri/src/tengri/forward/sed_model.py:3439: UserWarning: 1315/2400 (54.8%) spectral pixels have instrument resolution narrower than SSP library 'fsps_prsc_miles_chabrier''s own LSF at z=0.3: sigma_inst^2 - sigma_lib^2 is clamped to zero there (no broadening applied) rather than raising, which under-broadens the model in that unresolvable regime (#2518). (397 of those also fall in the library's approximate, FSPS-extrapolated resolution range rather than its own measured templates.) Use a coarser instrument resolution or a library with finer native resolution at these wavelengths.
  self._init_instrument(spec, observation)
Predicting 200 quiescent spectra (ages 6.0–8.928969303474283 Gyr)...
  Batch shape: (200, 2400)
import os

os.environ["TF_CPP_MIN_LOG_LEVEL"] = "2"  # suppress XLA/PjRt C++ INFO+WARNING logs

import warnings

import jax
import jax.numpy as jnp
import matplotlib.pyplot as plt
import numpy as np

import tengri
from tengri.components.stellar.sfh.registry import SFH_REGISTRY
from tengri.plot import setup_style

_PEAK_FRAC_LO, _PEAK_FRAC_HI = (
    SFH_REGISTRY["tsnorm"].params["sfh_tsnorm_peak_lbt_frac"].default.bounds
)

setup_style()
warnings.filterwarnings("ignore", message=".*BakedInBackend.*")

# --- Configuration: SDSS LRG sample parameters ---
N_MODELS = 200  # Number of stacked galaxies
REDSHIFT = 0.3  # SDSS LRG median (Eisenstein+2001)
RESOLUTION = 2000.0  # SDSS/BOSS spectroscopy (approx R~2000)
WAVE_REST_MIN = 3700.0  # Å (blue limit, avoids Lyman absorption)
WAVE_REST_MAX = 9000.0  # Å (red limit, covers near-IR)
WAVE_REST_NPIX = 2400  # Dense sampling for stacking

# Age range: red sequence Uniform(6, 11) Gyr (Thomas+2005)
AGE_GYR_MIN = 6.0
# The timing is sampled as a fraction of the age of the universe at REDSHIFT, and the
# fraction is bounded by the registry. At REDSHIFT the upper bound caps the age below 11 Gyr.
AGE_Z = float(tengri.cosmology.age_at_z(REDSHIFT))  # Gyr
AGE_GYR_MAX = min(11.0, _PEAK_FRAC_HI * AGE_Z)

# --- Load SSP ---
ssp = tengri.load_ssp()

# --- Setup wavelength grid (rest-frame) ---
wave_rest = jnp.linspace(WAVE_REST_MIN, WAVE_REST_MAX, WAVE_REST_NPIX)

# Create spectroscopy observation config at this resolution
spec_config = tengri.Spectroscopy(wave_obs=wave_rest, resolution=RESOLUTION)
obs = tengri.Observation(spectroscopy=spec_config)

# Build quiescent model with narrow tsnorm SFH (approximates single-age SSP)
model = tengri.SEDModel.build(
    ssp_data=ssp,
    observation=obs,
    # Narrow truncated-skew-normal burst (50 Myr 1σ), sliding in lookback
    # time → approximates a single-age stellar population
    sfh={
        "type": "tsnorm",
        "all_params": tengri.Fixed(tengri.DEFAULT),
        "peak_lbt_frac": tengri.Uniform(AGE_GYR_MIN / AGE_Z, AGE_GYR_MAX / AGE_Z),
        "width_gyr": 0.10,  # 50 Myr / sqrt(2.355) = narrow burst
        "skew": 0.0,
        "trunc": 13.5,
        "log_total_mass": 10.0,  # ~ log M* = 11 when integrated
    },
    dust_attenuation={
        "law": "power_law",
        "type": "two_component",
        "all_params": tengri.Fixed(tengri.DEFAULT),
        "tau_diff": 0.0,
        "tau_bc": 0.0,
    },
    redshift=tengri.Fixed(REDSHIFT),
)

# --- Collect baseline parameters ---
baseline_params = dict(model.spec.sample(jax.random.PRNGKey(0)))

# --- Generate age samples for population ---
# Sample N_MODELS ages uniformly within the red-sequence range
ages_gyr = np.linspace(AGE_GYR_MIN, AGE_GYR_MAX, N_MODELS)


# --- Define vmap-friendly predict function ---
def predict_single_spectrum(age_gyr):
    """Predict spectrum for a single age (rest-frame)."""
    params = {
        **baseline_params,
        "sfh_tsnorm_peak_lbt_frac": jnp.float64(age_gyr / AGE_Z),  # Override age
    }
    # Predict spectrum at rest-frame wavelengths
    flux_out = model.predict_spectrum(params, wave_obs=wave_rest)
    return flux_out  # Shape: (n_wave,)


# Vectorize over age samples
predict_batch = jax.vmap(predict_single_spectrum, in_axes=(0,))

# Predict spectra for all N_MODELS
print(f"Predicting {N_MODELS} quiescent spectra (ages {AGE_GYR_MIN}–{AGE_GYR_MAX} Gyr)...")
seds_batch = predict_batch(jnp.array(ages_gyr, dtype=jnp.float64))
print(f"  Batch shape: {seds_batch.shape}")

# --- Stack spectra: median flux per wavelength element ---
# seds_batch shape: (N_MODELS, n_wave)
flux_median = np.median(np.asarray(seds_batch), axis=0)

# --- Plot the stacked spectrum with feature labels ---
fig, ax = plt.subplots(figsize=(10.5, 5.5))

# Convert wavelength to rest-frame for labeling
wave_rest_array = np.asarray(wave_rest)

# Plot stacked spectrum
ax.plot(
    wave_rest_array,
    flux_median,
    color="C0",
    lw=1.4,
    label=f"SDSS LRG stack (z={REDSHIFT}, N={N_MODELS})",
)

# --- Mark spectral features (rest-frame wavelengths) ---
# D4000 break region (3800–4200 Å)
ax.axvspan(3750, 3950, alpha=0.15, color="C1", label="D4000 blue window")
ax.axvspan(4050, 4250, alpha=0.15, color="C2", label="D4000 red window")

# Mg b absorption (5167–5197 Å)
ax.axvline(5170, color="C3", linestyle="--", lw=1.2, alpha=0.7, label="Mg b 5170 Å")

# Ca II H+K lines (3933, 3968 Å)
ax.axvline(3933, color="C4", linestyle=":", lw=1.2, alpha=0.7, label="Ca II K 3933 Å")
ax.axvline(3968, color="C4", linestyle=":", lw=1.2, alpha=0.7, label="Ca II H 3968 Å")

# H-delta Balmer line (4102 Å)
ax.axvline(4102, color="C5", linestyle="-.", lw=1.0, alpha=0.6)

ax.set_xlim(3700, 9000)
ax.set_xlabel(r"Rest-frame wavelength $\lambda$ [$\mathrm{\AA}$]")
ax.set_ylabel(r"$L_\nu$ [erg s$^{-1}$ Hz$^{-1}$]")
ax.legend(frameon=False, fontsize=8, loc="upper right")

fig.tight_layout()
plt.savefig("plot_usecase_sdss_lrg_stack_template.png", dpi=150, bbox_inches="tight")
Total running time of the script: (0 minutes 5.444 seconds)