Note
Go to the end to download the full example code.
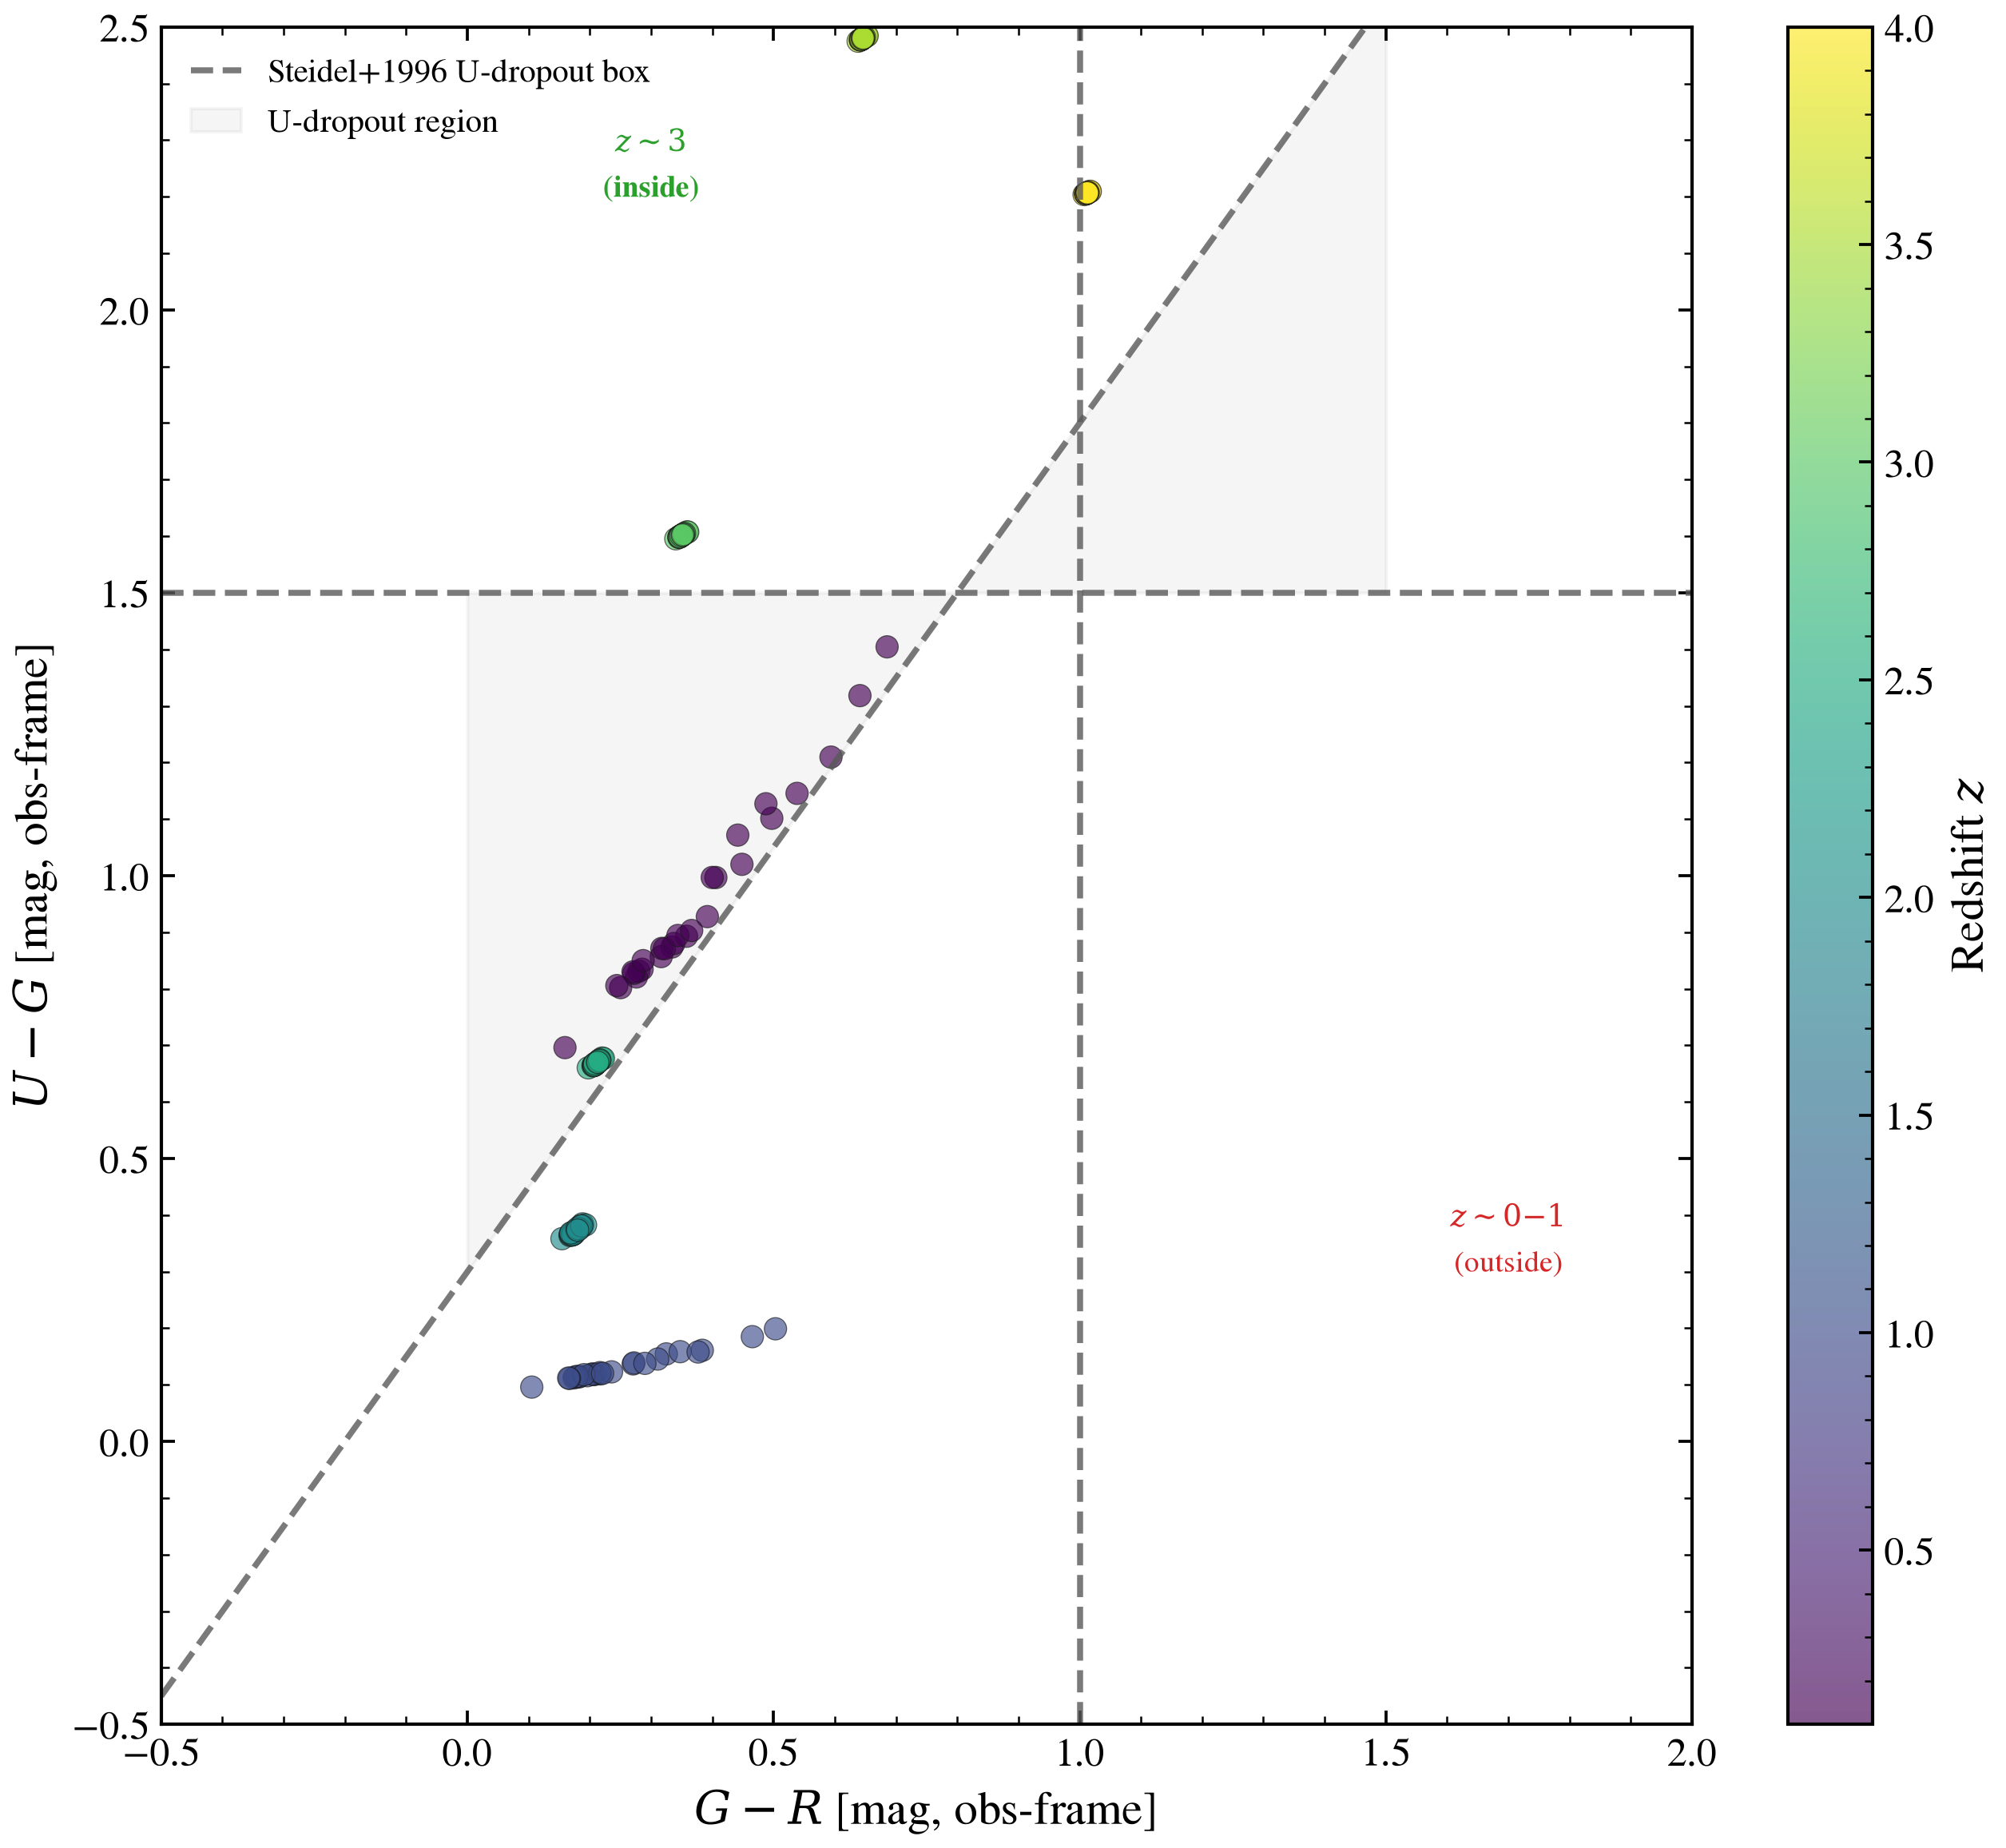
z~3 Lyman-break galaxy U-dropout selection: color-color diagnosis
Steidel+1996 U-dropout box is calibrated for a specific filter set and does not transfer to arbitrary filters: (U − G) > 1.0, (G − R) < 1.5, (U − G) > 1.5(G − R) + 0.3. True z~3 galaxies cluster inside; lower-redshift galaxies fall outside.
References
Steidel et al. 1996, ApJL, 462, L17 (Lyman-break selection at z ~ 3).
import os

from tengri.components.stellar.sfh.registry import SFH_REGISTRY

_PEAK_FRAC_LO, _PEAK_FRAC_HI = (
    SFH_REGISTRY["tsnorm"].params["sfh_tsnorm_peak_lbt_frac"].default.bounds
)

os.environ["TF_CPP_MIN_LOG_LEVEL"] = "2"  # suppress XLA/PjRt C++ INFO+WARNING logs

import warnings

import jax
import jax.numpy as jnp
import matplotlib.pyplot as plt
import numpy as np

import tengri
from tengri.plot import setup_style
from tengri.units import fnu_to_ab_mag

setup_style()
warnings.filterwarnings("ignore", message=".*BakedInBackend.*")

# ── Load data ──────────────────────────────────────────────────────

ssp = tengri.load_ssp()
bands = ["johnson_u", "sdss_g", "sdss_r"]
obs = tengri.Observation(photometry=tengri.Photometry.from_names(bands))

# ── Build model (fixed SFH and dust, variable redshift) ──────────────


def build_model(z: float) -> tengri.SEDModel:
    """Build a model at a given redshift."""
    # The peak is sampled as a fraction of the age of the universe at z: 0.5-6 Gyr
    # lookback, clipped to the declared fraction range.
    age = float(tengri.cosmology.age_at_z(z))  # Gyr
    return tengri.SEDModel.build(
        ssp,
        observation=obs,
        sfh={
            "type": "tsnorm",
            "log_total_mass": 10.0,
            "peak_lbt_frac": tengri.Uniform(0.5 / age, min(6.0 / age, _PEAK_FRAC_HI)),
            "width_gyr": tengri.Uniform(0.8, 3.0),
            "skew": tengri.Uniform(-0.5, 1.0),
            "trunc": tengri.Uniform(2.0, 8.0),
            "logzsol": tengri.Fixed(-0.1),
        },
        dust_attenuation={
            "law": "power_law",
            "type": "two_component",
            "all_params": tengri.Fixed(tengri.DEFAULT),
            "tau_bc": 0.3,
            "tau_diff": 0.2,
            "slope": -0.7,
        },
        redshift=tengri.Fixed(z),
    )


def _color(flux: np.ndarray) -> tuple[float, float]:
    """Compute (U-G, G-R) AB magnitude colors from flux tuple (f_u, f_g, f_r)."""
    f_u, f_g, f_r = float(flux[0]), float(flux[1]), float(flux[2])

    # Guard against non-positive fluxes
    if f_u <= 0 or f_g <= 0 or f_r <= 0:
        return np.nan, np.nan

    # Convert flux densities to AB magnitudes
    mag_u = float(fnu_to_ab_mag(jnp.array(f_u)))
    mag_g = float(fnu_to_ab_mag(jnp.array(f_g)))
    mag_r = float(fnu_to_ab_mag(jnp.array(f_r)))

    # Compute colors
    ug = mag_u - mag_g
    gr = mag_g - mag_r

    return ug, gr


def _sample_at_redshift(z: float, n: int, seed: int) -> tuple[np.ndarray, float]:
    """
    Sample galaxies at a single redshift.

    Returns
    -------
    colors : ndarray, shape (n, 2)
        Array of (U-G, G-R) colors
    z_val : float
        The redshift
    """
    model = build_model(z)
    colors = np.full((n, 2), np.nan)

    for i in range(n):
        # Sample parameters from prior
        key = jax.random.fold_in(jax.random.PRNGKey(seed), i)
        params = model.spec.sample(key)

        # Predict observed-frame photometry (f_nu)
        flux = np.asarray(model.predict_photometry(params))

        # Extract colors
        colors[i] = _color(flux)

    return colors, z


# ── Generate mock population ───────────────────────────────────────

# Redshifts to survey
z_vals = np.array([0.1, 1.0, 2.0, 2.5, 3.0, 3.5, 4.0])
n_per_z = 200 // len(z_vals)  # ~29 galaxies per redshift

all_colors = []
all_z = []

for z in z_vals:
    colors, z_ret = _sample_at_redshift(z, n_per_z, seed=42)
    all_colors.append(colors)
    all_z.append(np.full(n_per_z, z_ret))

all_colors = np.vstack(all_colors)
all_z = np.concatenate(all_z)

# Filter out NaN entries
valid = ~np.isnan(all_colors[:, 0]) & ~np.isnan(all_colors[:, 1])
all_colors = all_colors[valid]
all_z = all_z[valid]

# ── Plot ────────────────────────────────────────────────────────────

fig, ax = plt.subplots(figsize=(9, 8))

# Steidel+1996 U-dropout selection box
# Box boundary 1: (U - G) > 1.0 (vertical line)
gr_box = np.linspace(-0.5, 2.0, 100)
ug_box = 1.5 * gr_box + 0.3

# Plot the selection box boundary
ax.plot(
    [1.0, 1.0],
    [-0.5, 2.5],
    color="0.35",
    lw=1.8,
    ls="--",
    label="Steidel+1996 U-dropout box",
    alpha=0.8,
)
ax.plot(gr_box, ug_box, color="0.35", lw=1.8, ls="--", alpha=0.8)
ax.plot([-0.5, 2.0], [1.5, 1.5], color="0.35", lw=1.8, ls="--", alpha=0.8)

# Shade the selection region
gr_fill = np.linspace(0.0, 1.5, 100)
ug_fill = 1.5 * gr_fill + 0.3
ax.fill_between(gr_fill, ug_fill, 1.5, alpha=0.08, color="gray", label="U-dropout region")

# Color by redshift
cmap = plt.cm.viridis
norm = plt.Normalize(vmin=z_vals.min(), vmax=z_vals.max())

scatter = ax.scatter(
    all_colors[:, 1],
    all_colors[:, 0],
    c=all_z,
    cmap=cmap,
    s=45,
    alpha=0.65,
    edgecolor="0.1",
    linewidth=0.3,
    norm=norm,
    rasterized=True,
)

# Colorbar
cbar = plt.colorbar(scatter, ax=ax, label=r"Redshift $z$")

# Axis labels
ax.set_xlim(-0.5, 2.0)
ax.set_ylim(-0.5, 2.5)
ax.set_xlabel(r"$G - R$ [mag, obs-frame]")
ax.set_ylabel(r"$U - G$ [mag, obs-frame]")
ax.legend(frameon=False, loc="upper left", fontsize=10)

# Add region annotations
ax.text(
    0.3, 2.2, r"$z \sim 3$" + "\n(inside)", fontsize=9, ha="center", color="#2ca02c", weight="bold"
)
ax.text(1.7, 0.3, r"$z \sim 0{-}1$" + "\n(outside)", fontsize=9, ha="center", color="#d62728")

fig.tight_layout()
plt.savefig("plot_usecase_dropout_selection_z3.png", dpi=150, bbox_inches="tight")
Total running time of the script: (0 minutes 12.235 seconds)