Note
Go to the end to download the full example code.
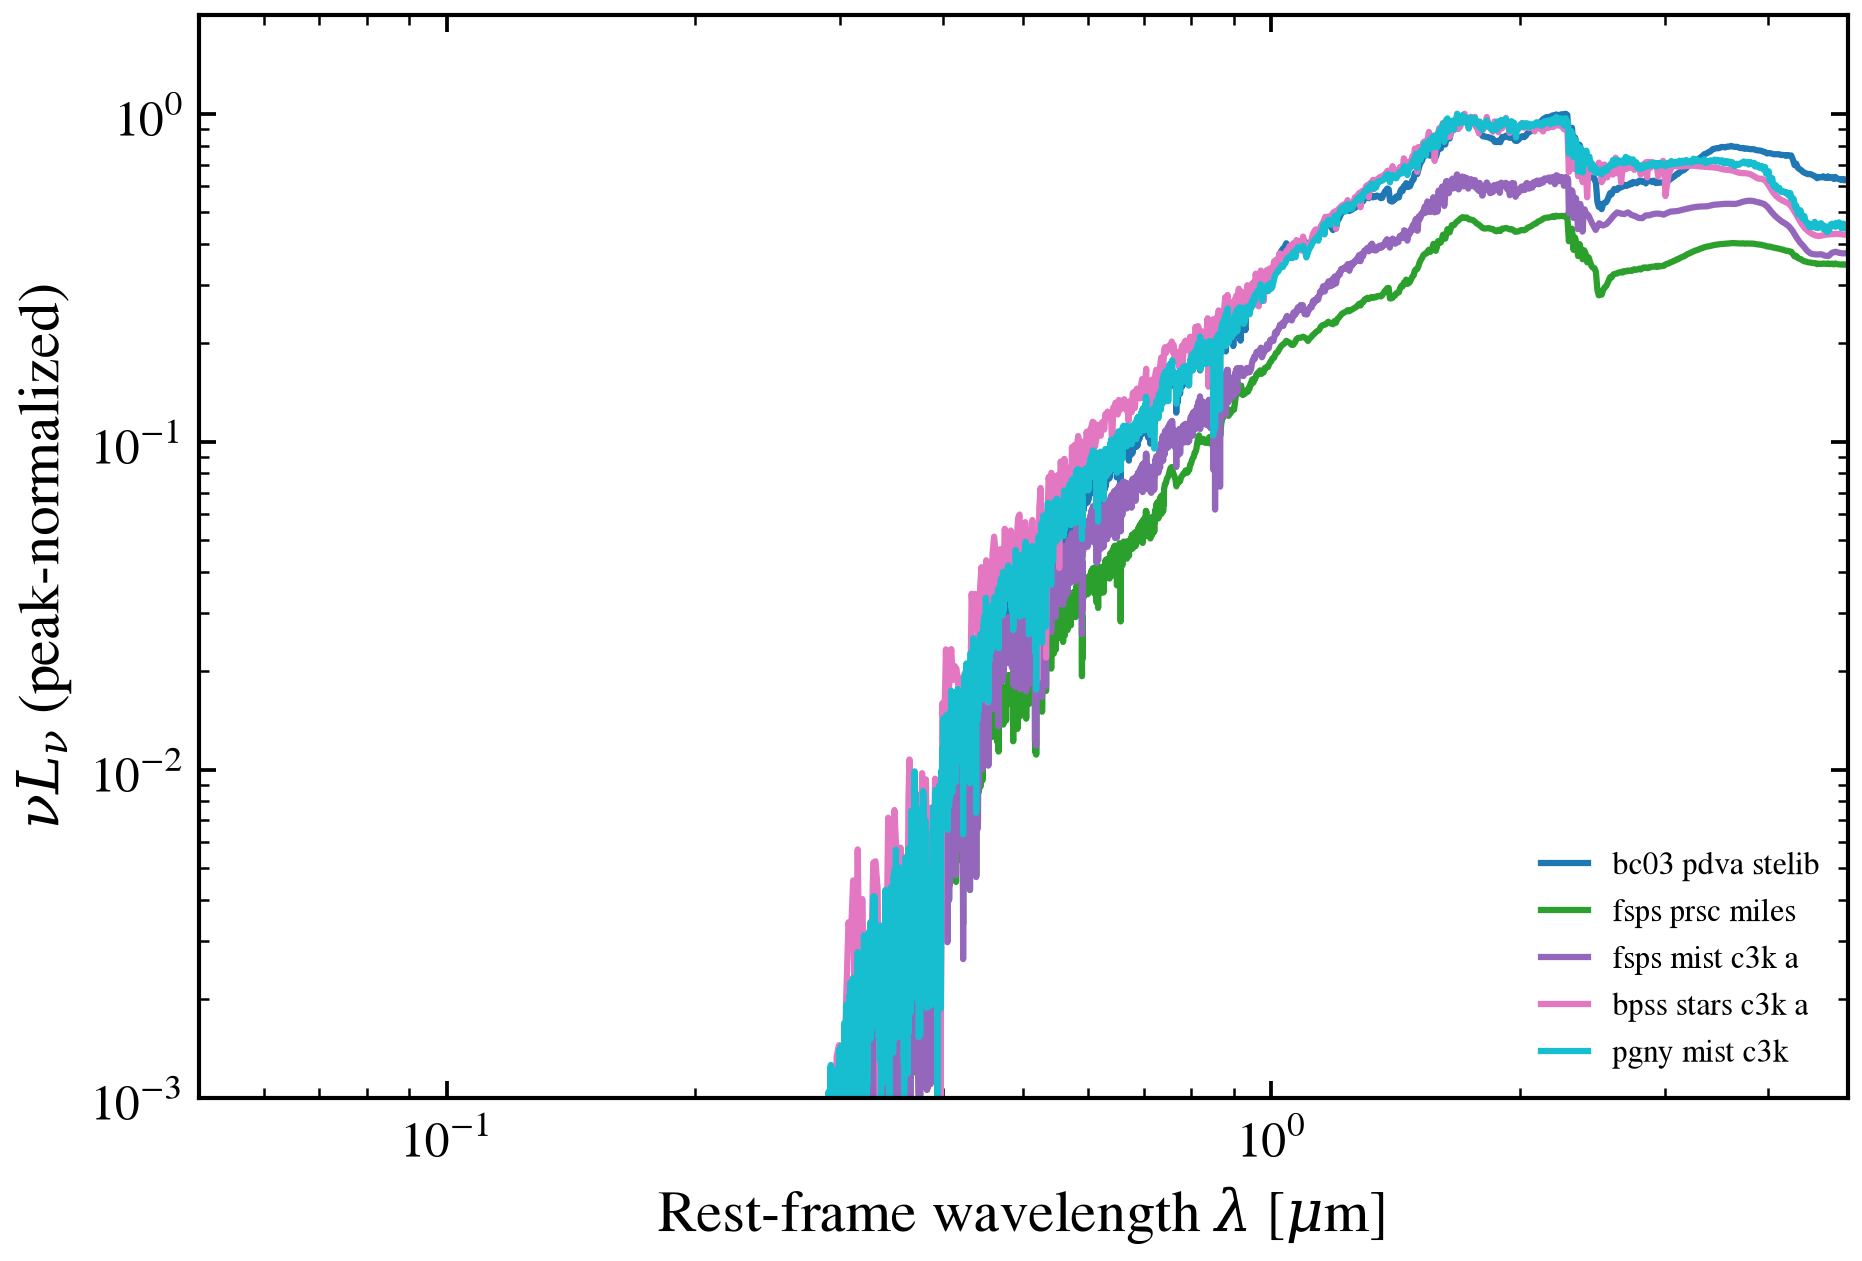
SSP Library Shootout: Comparing Spectral Predictions at 5 Gyr, Z=0
Stellar population synthesis templates differ across stellar evolution codes and
isochrone libraries, producing measurable offsets in predicted spectra even at
fixed age and metallicity. This gallery script loads four representative SSP
libraries shipped with tengri (BC03, FSPS MILES, FSPS C3K, BPASS, ProGeny),
constructs minimal SEDModel instances at age = 5 Gyr and Z = 0 (solar),
and overlays rest-frame SED predictions (νL_ν) on log-log axes to reveal
template-dependent uncertainties and continuum shape differences.
References:
Bruzual & Charlot 2003 (BC03): ApJ 405, 538
Conroy et al. 2009 (FSPS): ApJ 699, 486
Vazdekis et al. 2010 (MILES): MNRAS 404, 1639
import os

os.environ["TF_CPP_MIN_LOG_LEVEL"] = "2"  # suppress XLA/PjRt C++ INFO+WARNING logs

import warnings

import matplotlib.pyplot as plt
import numpy as np

import tengri
from tengri.plot import setup_style

setup_style()
warnings.filterwarnings("ignore", message=".*BakedInBackend.*")

# Representative subset of shipped SSP libraries: BC03, FSPS (MILES + C3K), BPASS, ProGeny
ssp_names = [
    "bc03_pdva_stelib_chabrier",  # BC03 with Padova 1994 isochrones
    "fsps_prsc_miles_chabrier",  # FSPS + Padova 2000 + MILES library
    "fsps_mist_c3k_a_chabrier",  # FSPS + MIST + C3K
    "bpss_stars_c3k_a_chabrier",  # BPASS binary star synthesis
    "pgny_mist_c3k_chabrier",  # ProGeny + MIST
]

# Target age (Gyr) for cross-section and Z (log10 absolute)
target_age_gyr = 5.0
target_log10_z = 0.0  # solar

# Load SSPs, extract rest-frame SED at fixed age/Z for each
colors = plt.cm.tab10(np.linspace(0, 0.9, len(ssp_names)))
fig, ax = plt.subplots(figsize=(6.5, 4.5))

plotted = 0
first_failure: Exception | None = None

for ssp_name, color in zip(ssp_names, colors):
    try:
        # Load SSP library
        # Only the spectra are plotted and the surviving mass is not used, so every
        # grid takes the explicit DSPS fit for its surviving mass.
        ssp = tengri.load_ssp(ssp_name, mass_remaining="dsps_fit")

        # Extract wavelength grid (rest-frame, Angstrom)
        wave = np.array(ssp.ssp_wave)

        # Find nearest age and metallicity grid points
        age_gyr = 10.0 ** np.array(ssp.ssp_lg_age_gyr)
        log_z = np.array(ssp.ssp_lgmet)

        age_idx = np.argmin(np.abs(age_gyr - target_age_gyr))
        z_idx = np.argmin(np.abs(log_z - target_log10_z))

        # Extract SSP flux at (age, Z) — shape (n_wave,)
        # ssp.ssp_flux has shape (n_met, n_age, n_wave)
        flux = np.array(ssp.ssp_flux[z_idx, age_idx, :])

        # Compute νL_ν = λ × F_λ (rest-frame, erg/s/Hz)
        nu_lnu = wave * flux

        # Normalize to max for comparison of continuum shapes
        nu_lnu_norm = nu_lnu / np.nanmax(nu_lnu)

        # Trim to valid range (avoid NaNs, negatives)
        mask = (nu_lnu_norm > 0) & np.isfinite(nu_lnu_norm)
        ax.loglog(
            (wave[mask] / 1e4),
            nu_lnu_norm[mask],
            lw=1.5,
            color=color,
            label=ssp_name.replace("_chabrier", "").replace("_", " "),
        )
        plotted += 1

    except Exception as e:
        # Was `except (FileNotFoundError, Exception)` with a bare `pass`. The
        # tuple's second member subsumes the first, so this caught every error
        # in a ~30-line body — the grid lookup, the normalization, the plot call
        # — and discarded all of them.
        if first_failure is None:
            first_failure = e

if plotted == 0:
    raise RuntimeError(
        f"none of the {len(ssp_names)} SSP libraries produced a curve, so the "
        f"shootout is empty. First failure: "
        f"{type(first_failure).__name__}: {first_failure}"
    ) from first_failure

ax.set_xlim(0.05, 5.0)
ax.set_ylim(1e-3, 2.0)
ax.set_xlabel(r"Rest-frame wavelength $\lambda$ [$\mu$m]")
ax.set_ylabel(r"$\nu L_\nu$ (peak-normalized)")

ax.legend(fontsize=7.5, frameon=False, loc="lower right", ncol=1)

fig.tight_layout()
plt.savefig("plot_ssp_library_shootout.png", dpi=150, bbox_inches="tight")