Note
Go to the end to download the full example code.
Classic spectral indices vs single-burst age
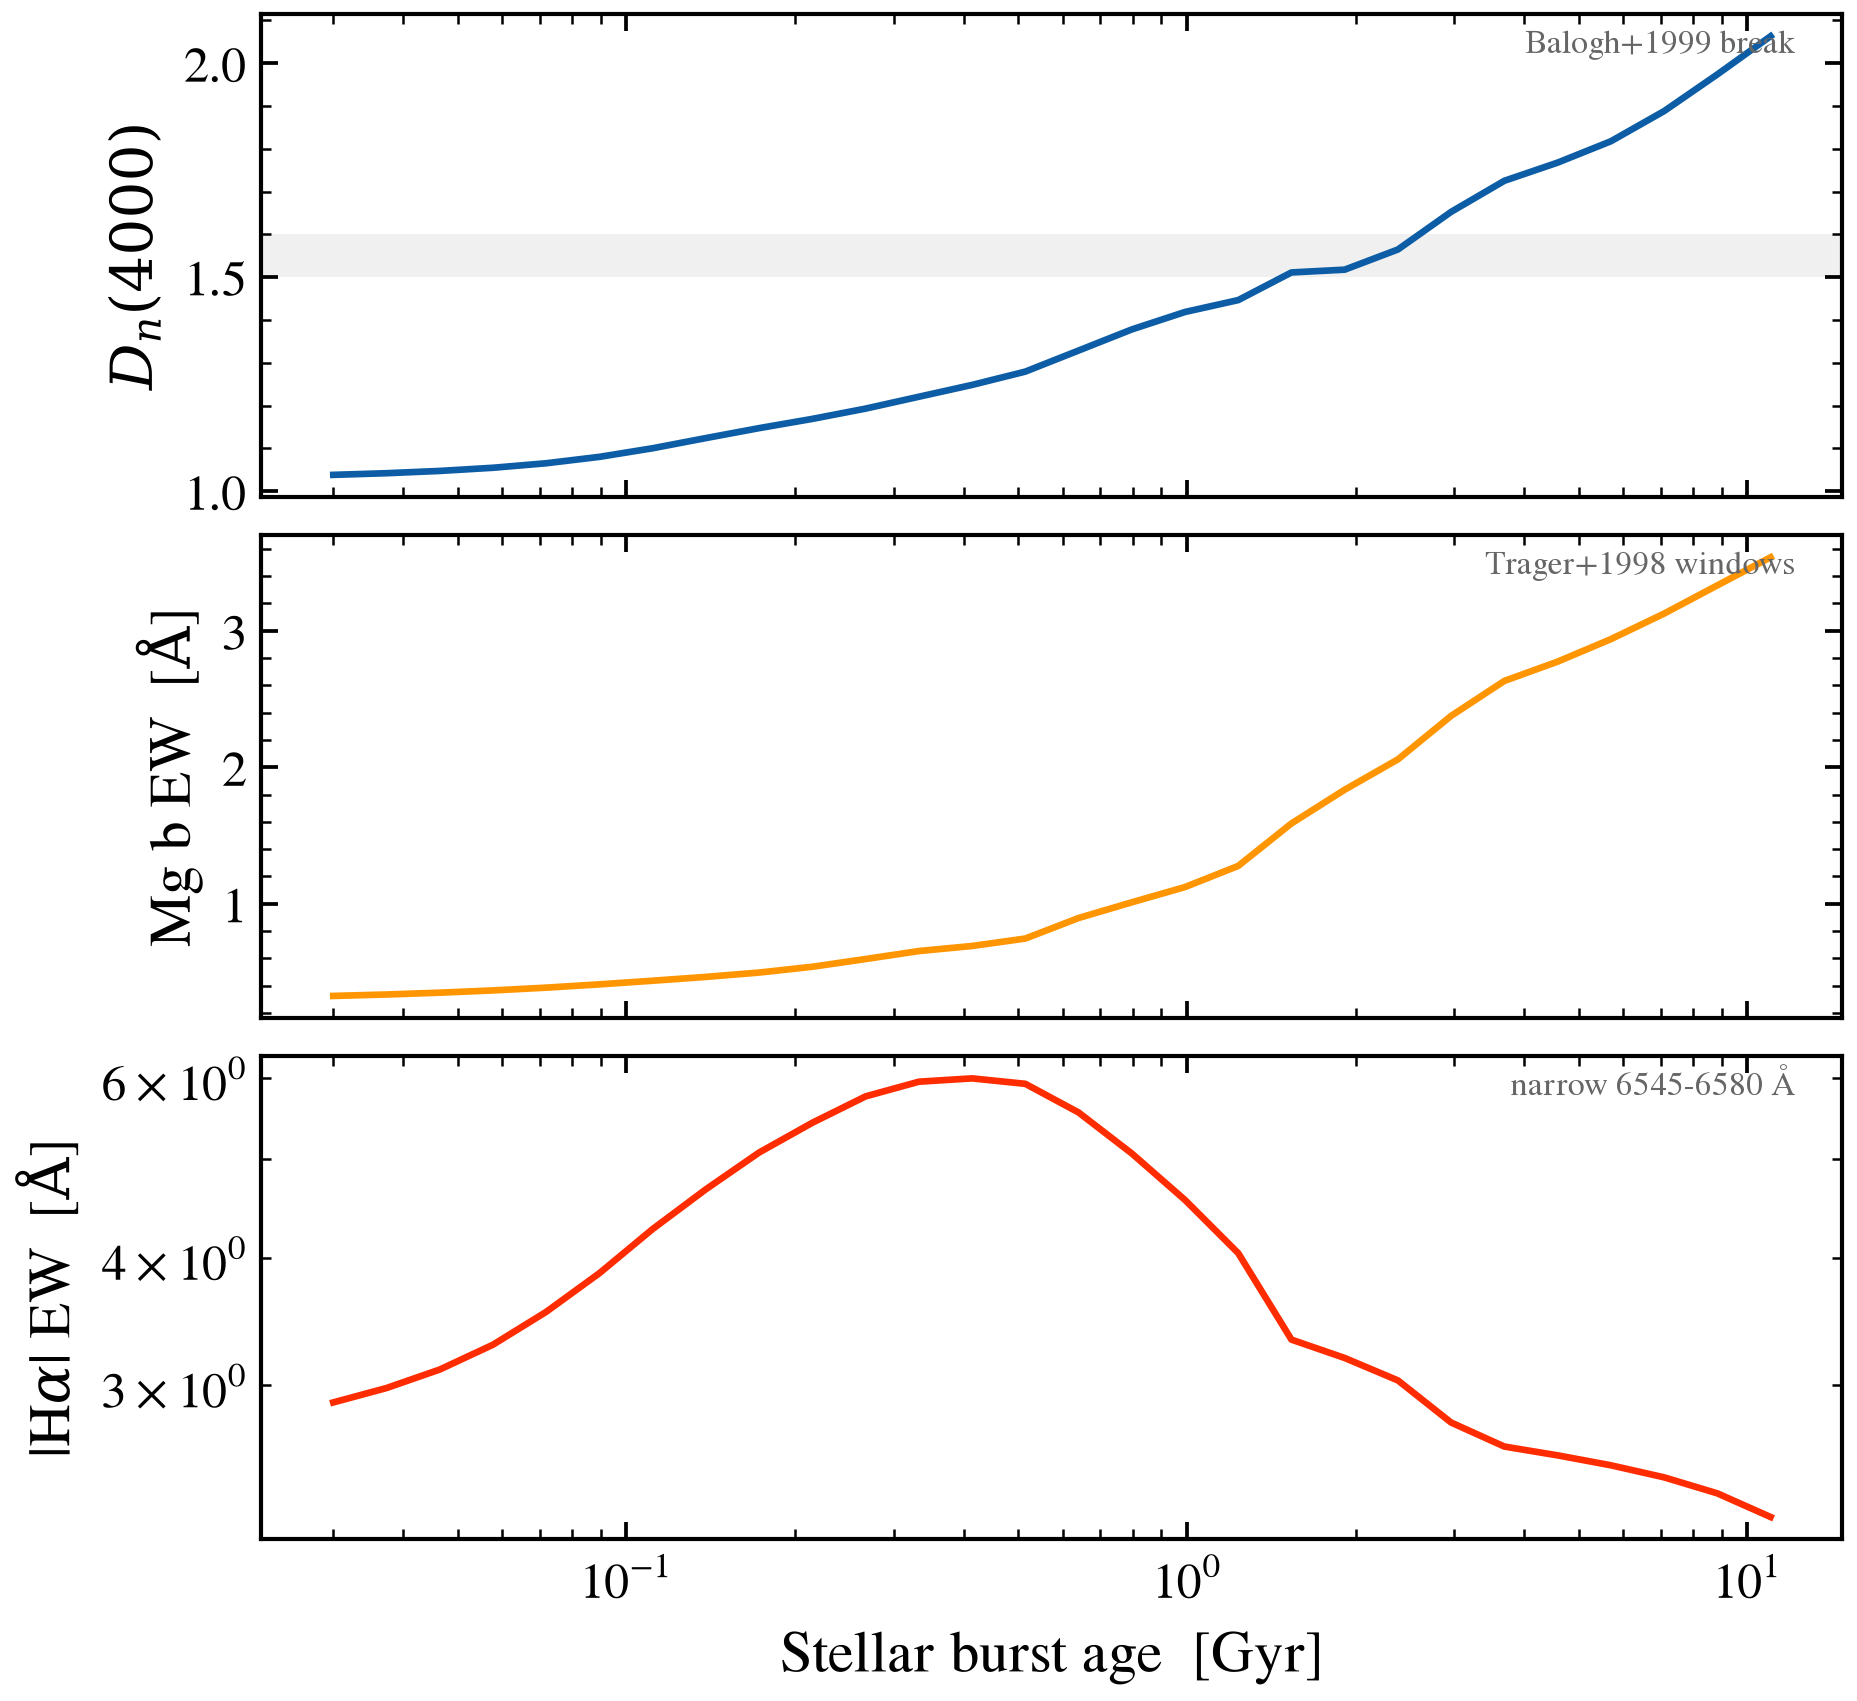
Three of the most-used optical absorption / emission diagnostics evaluated on a single-burst stellar population from 30 Myr to 13 Gyr, at solar metallicity, no dust. The figure makes obvious which diagnostic responds on which timescale:
D_n(4000)Balogh+1999 break-strength — rises over Gyr, the slowest clockMg b5170 Å, EW computed in the Trager+1998 windows — rises over Gyr (sensitive to α-element abundance + age)Hαnarrow EW, rises briefly during the WR + nebular epoch (≲ 30 Myr) then drops over Myr as O stars die
The age axis is shared so the responses can be compared.
/tengri/src/tengri/forward/sed_model.py:13787: SFHBeyondOldestTemplateWarning: The SSP grid's oldest template is 12.589 Gyr but the universe is 13.787 Gyr old at redshift 0. Stars formed in that gap are older than every template, so both age kernels assign them to the oldest one: the formed mass is conserved, and those stars carry the colors of a 12.589 Gyr population. Use a grid whose oldest template reaches 13.787 Gyr (e.g. MIST) to remove the approximation.
  return cls(
import os

from tengri.components.stellar.sfh.registry import SFH_REGISTRY

_PEAK_FRAC_LO, _PEAK_FRAC_HI = (
    SFH_REGISTRY["tsnorm"].params["sfh_tsnorm_peak_lbt_frac"].default.bounds
)

os.environ["TF_CPP_MIN_LOG_LEVEL"] = "2"  # suppress XLA/PjRt C++ INFO+WARNING logs

import warnings

import jax
import jax.numpy as jnp
import matplotlib.pyplot as plt
import numpy as np

import tengri
from tengri.plot import setup_style

setup_style()
warnings.filterwarnings("ignore", message=".*BakedInBackend.*")

C_AA_PER_S = 2.998e18


def _balogh_d4000(wave, l_nu):
    blue = (wave >= 3850) & (wave <= 3950)
    red = (wave >= 4000) & (wave <= 4100)
    return float(np.mean(l_nu[red]) / np.mean(l_nu[blue]))


def _mgb_ew(wave, l_nu):
    line = (wave >= 5160) & (wave <= 5193)
    blue = (wave >= 5142) & (wave <= 5161)
    red = (wave >= 5191) & (wave <= 5206)
    f_lam = l_nu * C_AA_PER_S / wave**2
    cont_blue = np.mean(f_lam[blue])
    cont_red = np.mean(f_lam[red])
    # linear interpolation of the continuum across the line window
    lam_blue = 0.5 * (5142 + 5161)
    lam_red = 0.5 * (5191 + 5206)
    slope = (cont_red - cont_blue) / (lam_red - lam_blue)
    cont = cont_blue + slope * (wave[line] - lam_blue)
    delta = wave[line][1] - wave[line][0] if line.sum() > 1 else 1.0
    return float(np.sum(1.0 - f_lam[line] / cont) * delta)


def _halpha_ew(wave, l_nu):
    line = (wave >= 6545) & (wave <= 6580)
    cont_lo = (wave >= 6450) & (wave <= 6540)
    cont_hi = (wave >= 6580) & (wave <= 6650)
    f_lam = l_nu * C_AA_PER_S / wave**2
    cont = np.median(np.concatenate([f_lam[cont_lo], f_lam[cont_hi]]))
    delta = wave[line][1] - wave[line][0] if line.sum() > 1 else 1.0
    return float(np.sum(f_lam[line] - cont) * delta) / max(cont, 1e-30)


SFH = {
    "type": "tsnorm",
    "all_params": tengri.Fixed(tengri.DEFAULT),
    "peak_lbt_frac": tengri.Uniform(_PEAK_FRAC_LO, _PEAK_FRAC_HI),
    "width_gyr": 0.05,
    "log_total_mass": 10.0,
    "skew": 0.0,
    "trunc": 13.0,
}
DUST = {
    "law": "power_law",
    "type": "two_component",
    "all_params": tengri.Fixed(tengri.DEFAULT),
    "tau_diff": 0.0,
    "tau_bc": 0.0,
}

ssp = tengri.load_ssp()
model = tengri.SEDModel.build(ssp, sfh=SFH, dust_attenuation=DUST, redshift=tengri.Fixed(0.0))
baseline = dict(model.spec.sample(jax.random.PRNGKey(0)))
AGE_Z = float(tengri.cosmology.age_at_z(0.0))  # Gyr

ages = np.geomspace(0.03, 11.0, 28)
d4000_arr = np.empty_like(ages)
mgb_arr = np.empty_like(ages)
ha_arr = np.empty_like(ages)

for i, age in enumerate(ages):
    p = {**baseline, "sfh_tsnorm_peak_lbt_frac": jnp.float64(age / AGE_Z)}
    out = model.predict(p)
    wave = np.asarray(model.wavelengths)
    l_nu = np.asarray(out.rest_sed())
    d4000_arr[i] = _balogh_d4000(wave, l_nu)
    mgb_arr[i] = _mgb_ew(wave, l_nu)
    ha_arr[i] = _halpha_ew(wave, l_nu)

fig, axes = plt.subplots(3, 1, figsize=(6.8, 6.6), sharex=True, gridspec_kw={"hspace": 0.08})
ax_d, ax_m, ax_h = axes

ax_d.plot(ages, d4000_arr, color="C0", lw=1.6)
ax_d.axhspan(1.5, 1.6, color="0.92", alpha=0.7, lw=0)
ax_d.set_ylabel(r"$D_n(4000)$")
ax_d.text(
    0.97, 0.92, "Balogh+1999 break", transform=ax_d.transAxes, ha="right", fontsize=8, color="0.4"
)

ax_m.plot(ages, mgb_arr, color="C2", lw=1.6)
ax_m.set_ylabel(r"Mg b EW  [$\mathrm{\AA}$]")
ax_m.text(
    0.97,
    0.92,
    "Trager+1998 windows",
    transform=ax_m.transAxes,
    ha="right",
    fontsize=8,
    color="0.4",
)

ax_h.plot(ages, np.abs(ha_arr), color="C3", lw=1.6)
ax_h.set_ylabel(r"|H$\alpha$| EW  [$\mathrm{\AA}$]")
ax_h.set_yscale("log")
ax_h.text(
    0.97, 0.92, "narrow 6545-6580 Å", transform=ax_h.transAxes, ha="right", fontsize=8, color="0.4"
)

ax_h.set_xscale("log")
ax_h.set_xlabel(r"Stellar burst age  [Gyr]")

plt.savefig("plot_spectral_indices_vs_age.png", dpi=150, bbox_inches="tight")
Total running time of the script: (0 minutes 4.610 seconds)