Note
Go to the end to download the full example code.
Parametric SFH form atlas
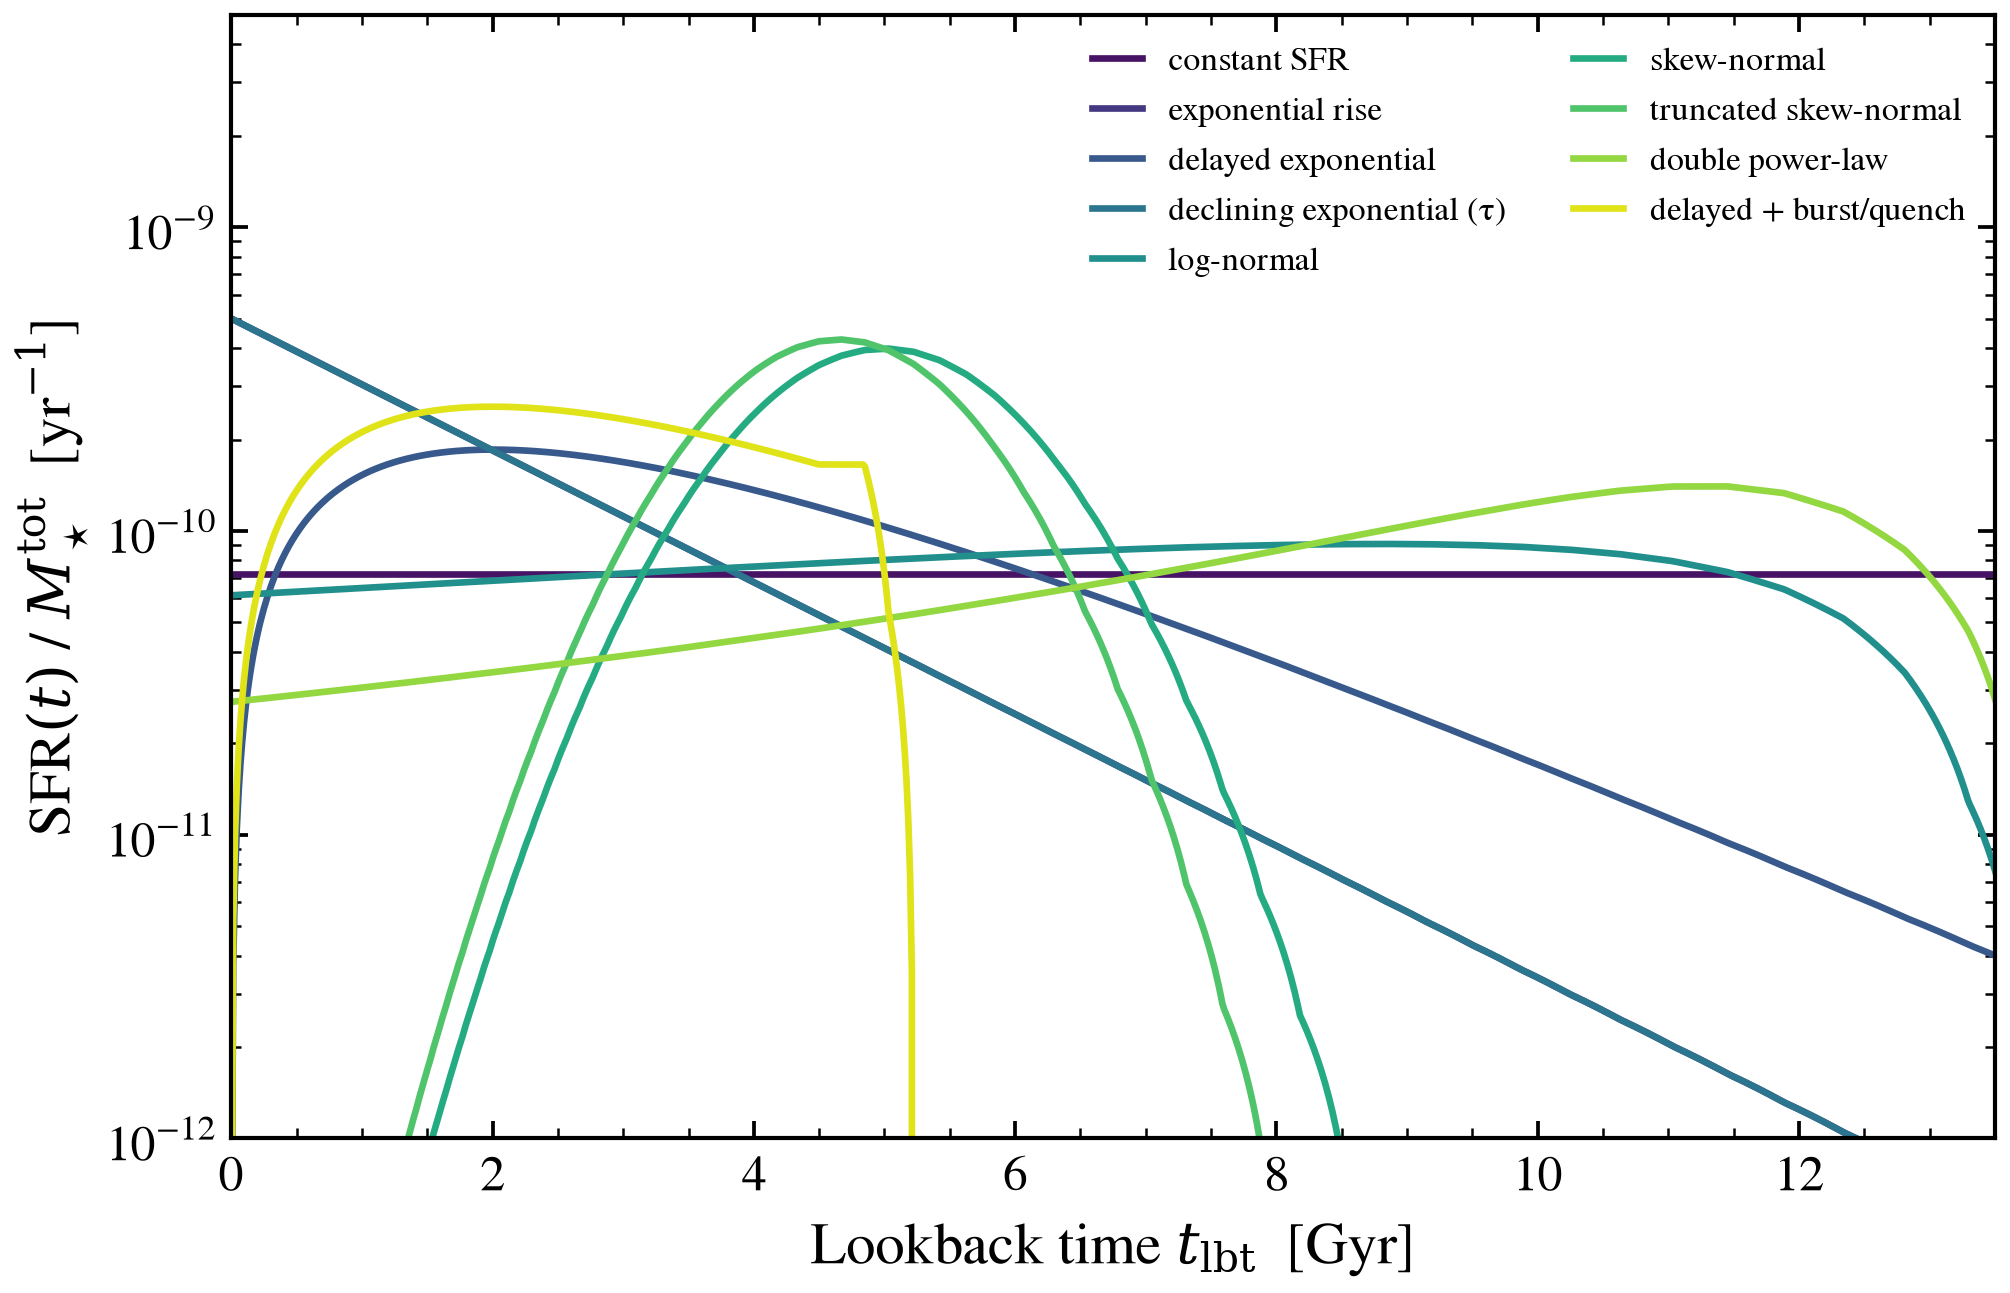
Each parametric SFH in tengri encodes a different prior on when a galaxy forms its stars. We overlay the SFR(t) shape of nine production-status forms at their default parameter values, all integrated to the same total stellar mass, so the differences are entirely in the shape — not the normalization.
Forms shown:
const,exp,dexp,tau— single-parameter classicslnorm,snorm,tsnorm— peaked smooth familiesdpl: Carnall+2018 double power-lawdelayed_bq: Ciesla+ delayed + late burst/quench
Pick a form by matching the data you have: tau for a single color,
dpl for broadband UV-NIR, tsnorm for spectroscopy with the
4000 Å break, delayed_bq for post-starburst signatures, the
non-parametric forms (continuity, dirichlet, dense_basis)
when the data resolve > 5 SFR-bins.
import os

os.environ["TF_CPP_MIN_LOG_LEVEL"] = "2"  # suppress XLA/PjRt C++ INFO+WARNING logs

import warnings

import jax
import matplotlib.pyplot as plt
import numpy as np

import tengri
from tengri.plot import setup_style

setup_style()
warnings.filterwarnings("ignore", message=".*BakedInBackend.*")

FORMS = [
    ("const", "constant SFR"),
    ("exp", "exponential rise"),
    ("dexp", "delayed exponential"),
    ("exp", "declining exponential (τ)"),
    ("lnorm", "log-normal"),
    ("snorm", "skew-normal"),
    ("tsnorm", "truncated skew-normal"),
    ("dpl", "double power-law"),
    ("delayed_bq", "delayed + burst/quench"),
]
COLORS = plt.cm.viridis(np.linspace(0.05, 0.95, len(FORMS)))

ssp = tengri.load_ssp()
fig, ax = plt.subplots(figsize=(7.0, 4.6))

for (form, label), color in zip(FORMS, COLORS):
    model = tengri.SEDModel.build(
        ssp,
        sfh={"type": form, "all_params": tengri.Fixed(tengri.DEFAULT)},
        dust_attenuation={
            "law": "power_law",
            "type": "two_component",
            "all_params": tengri.Fixed(tengri.DEFAULT),
        },
        redshift=tengri.Fixed(0.0),
    )
    p = dict(model.spec.sample(jax.random.PRNGKey(0)))
    sfh = model.predict_sfh(p)
    t_gyr = np.asarray(sfh["t_gyr"])
    sfr = np.asarray(sfh["sfr_mean"])
    if sfr.sum() > 0:
        mass = np.trapezoid(sfr, t_gyr * 1.0e9)
        sfr = sfr / mass if mass > 0 else sfr
    ax.plot(t_gyr, sfr, color=color, lw=1.6, label=label)

ax.set(
    xlabel=r"Lookback time $t_{\rm lbt}$  [Gyr]",
    ylabel=r"SFR$(t)$ / $M_\star^{\rm tot}$  [yr$^{-1}$]",
    yscale="log",
    xlim=(0.0, 13.5),
    ylim=(1e-12, 5e-9),
)
ax.legend(frameon=False, fontsize=8, loc="upper right", ncol=2)

fig.tight_layout()
plt.savefig("plot_sfh_form_compare.png", dpi=150, bbox_inches="tight")